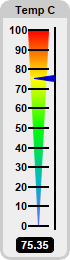
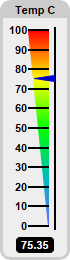
This example demonstrates vertical bar meters in a white coloring scheme.
ChartDirector 7.0 (Perl Edition)
White Vertical Linear Meters
Source Code Listing
#!/usr/bin/perl
# The ChartDirector for Perl module is assumed to be in "../lib"
use File::Basename;
use lib (dirname($0)."/../lib") =~ /(.*)/;
use perlchartdir;
sub createChart
{
my $chartIndex = shift;
# The value to display on the meter
my $value = 75.35;
# Create a LinearMeter object of size 250 x 75 pixels with very light grey (0xeeeeee) backgruond
# and a light grey (0xccccccc) 3-pixel thick rounded frame
my $m = new LinearMeter(70, 260, 0xeeeeee, 0xcccccc);
$m->setRoundedFrame($perlchartdir::Transparent);
$m->setThickFrame(3);
# Set the scale region top-left corner at (28, 30), with size of 20 x 196 pixels. The scale
# labels are located on the left (default - implies vertical meter)
$m->setMeter(28, 30, 20, 196);
# Set meter scale from 0 - 100, with a tick every 10 units
$m->setScale(0, 100, 10);
# Demostrate different types of color scales and putting them at different positions
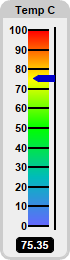
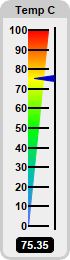
my $smoothColorScale = [0, 0x6666ff, 25, 0x00bbbb, 50, 0x00ff00, 75, 0xffff00, 100, 0xff0000];
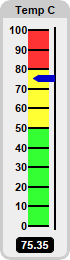
my $stepColorScale = [0, 0x33ff33, 50, 0xffff33, 80, 0xff3333, 100];
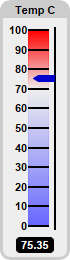
my $highLowColorScale = [0, 0x6666ff, 70, $perlchartdir::Transparent, 100, 0xff0000];
if ($chartIndex == 0) {
# Add the smooth color scale at the default position
$m->addColorScale($smoothColorScale);
} elsif ($chartIndex == 1) {
# Add the step color scale at the default position
$m->addColorScale($stepColorScale);
} elsif ($chartIndex == 2) {
# Add the high low scale at the default position
$m->addColorScale($highLowColorScale);
} elsif ($chartIndex == 3) {
# Add the smooth color scale starting at x = 28 (left of scale) with zero width and ending
# at x = 28 with 20 pixels width
$m->addColorScale($smoothColorScale, 28, 0, 28, 20);
} elsif ($chartIndex == 4) {
# Add the smooth color scale starting at x = 38 (center of scale) with zero width and ending
# at x = 28 with 20 pixels width
$m->addColorScale($smoothColorScale, 38, 0, 28, 20);
} else {
# Add the smooth color scale starting at x = 48 (right of scale) with zero width and ending
# at x = 28 with 20 pixels width
$m->addColorScale($smoothColorScale, 48, 0, 28, 20);
}
# In this demo, we demostrate pointers of different shapes
if ($chartIndex < 3) {
# Add a blue (0x0000cc) pointer of default shape at the specified value
$m->addPointer($value, 0x0000cc);
} else {
# Add a blue (0x0000cc) pointer of triangular shape the specified value
$m->addPointer($value, 0x0000cc)->setShape($perlchartdir::TriangularPointer, 0.7, 0.5);
}
# Add a title using 8pt Arial Bold font with a border color background
$m->addTitle("Temp C", "Arial Bold", 8, $perlchartdir::TextColor)->setBackground(0xcccccc);
# Add a text box at the bottom-center. Display the value using white (0xffffff) 8pt Arial Bold
# font on a black (0x000000) background with rounded border.
my $t = $m->addText($m->getWidth() / 2, $m->getHeight() - 8, $m->formatValue($value, "2"),
"Arial Bold", 8, 0xffffff, $perlchartdir::Bottom);
$t->setBackground(0x000000);
$t->setRoundedCorners(3);
$t->setMargin2(5, 5, 2, 1);
# Output the chart
$m->makeChart("whitevlinearmeter$chartIndex.png");
}
createChart(0);
createChart(1);
createChart(2);
createChart(3);
createChart(4);
createChart(5);