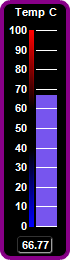
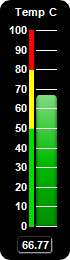
This example demonstrates vertical bar meters in a black coloring scheme, and with bars in various shading styles.
ChartDirector 7.0 (PHP Edition)
Black Vertical Bar Meters
Source Code Listing
<?php
require_once("../lib/phpchartdir.php");
function createChart($viewer, $chartIndex)
{
# The value to display on the meter
$value = 66.77;
# Create a LinearMeter object of size 70 x 260 pixels with black background and rounded corners
$m = new LinearMeter(70, 260, 0x000000);
$m->setRoundedFrame(Transparent);
# Set the default text and line colors to white (0xffffff)
$m->setColor(TextColor, 0xffffff);
$m->setColor(LineColor, 0xffffff);
# Set the scale region top-left corner at (36, 30), with size of 20 x 196 pixels. The scale
# labels are located on the left (default - implies vertical meter).
$m->setMeter(36, 30, 20, 196);
# Set meter scale from 0 - 100, with a tick every 10 units
$m->setScale(0, 100, 10);
# Add the chart title at the top center
$title = $m->addText($m->getWidth() / 2, 5, "Temp C", "Arial Bold", 8, TextColor, TopCenter);
# Move the scale labels 8 pixels from the meter scale to make room for the color scale
$m->setLabelPos(false, 8);
# Demostrate different types of color scales
$smoothColorScale = array(0, 0x0000ff, 25, 0x0088ff, 50, 0x00ff00, 75, 0xdddd00, 100, 0xff0000);
$stepColorScale = array(0, 0x00dd00, 50, 0xffff00, 80, 0xff0000, 100);
$highLowColorScale = array(0, 0x0000ff, 40, Transparent, 60, Transparent, 100, 0xff0000);
$highColorScale = array(70, Transparent, 100, 0xff0000);
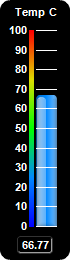
if ($chartIndex == 0) {
# Add a blue (0x0088ff) bar from 0 to value with glass effect and 4 pixel rounded corners
$m->addBar(0, $value, 0x0088ff, glassEffect(NormalGlare, Left), 4);
# Add a 4-pixel thick smooth color scale at x = 29 (left of meter scale)
$m->addColorScale($smoothColorScale, 29, 4);
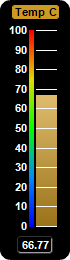
} else if ($chartIndex == 1) {
# Add a yellow (0xCC9922) bar from 0 to value with bar lighting effect
$m->addBar(0, $value, 0xcc9922, barLighting());
# Add a 4-pixel thick smooth color scale at x = 29 (left of meter scale)
$m->addColorScale($smoothColorScale, 29, 4);
# Set the title style to black text on a yellow (0xcc9922) background with rounded corners
$title->setFontColor(0x000000);
$title->setBackground(0xcc9922);
$title->setRoundedCorners(2);
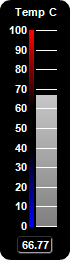
} else if ($chartIndex == 2) {
# Add a grey (0xaaaaaa) bar from 0 to value with bar lighting effect
$m->addBar(0, $value, 0xaaaaaa, barLighting());
# Add a 4-pixel high/low color scale at x = 29 (left of meter scale)
$m->addColorScale($highLowColorScale, 29, 4);
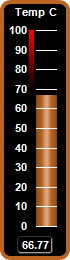
} else if ($chartIndex == 3) {
# Add a brown (0xbb6622) bar from 0 to value with cylinder lighting effect
$m->addBar(0, $value, 0xbb6622, cylinderEffect());
# Add a 4 pixel thick brown (0xbb6622) frame
$m->setThickFrame(4, 0xbb6622);
# Add a high only color scale at x = 29 (left of meter scale)
$m->addColorScale($highColorScale, 29, 4);
} else if ($chartIndex == 4) {
# Add a purple (0x7755ee) bar from 0 to value
$m->addBar(0, $value, 0x7755ee);
# Add a 4 pixel thick purple (0x880088) frame
$m->setThickFrame(4, 0x880088);
# Add a 4-pixel high/low color scale at x = 29 (left of meter scale)
$m->addColorScale($highLowColorScale, 29, 4);
} else {
# Add a green (0x00bb00) bar from 0 to value with soft lighting effect and 4 pixel rounded
# corners
$m->addBar(0, $value, 0x00bb00, softLighting(), 4);
# Add a 4-pixel step color scale at x = 29 (left of meter scale)
$m->addColorScale($stepColorScale, 29, 4);
}
# Add a text box at the bottom-center. Display the value using white (0xffffff) 8pt Arial Bold
# font on a black (0x000000) background with depressed grey (0x333333) rounded border.
$t = $m->addText($m->getWidth() / 2, $m->getHeight() - 7, $m->formatValue($value, "2"),
"Arial Bold", 8, 0xffffff, BottomCenter);
$t->setBackground(0x000000, 0x333333, -1);
$t->setRoundedCorners(3);
# Output the chart
$viewer->setChart($m, SVG);
}
# This example includes 6 charts
$viewers = array();
for ($i = 0; $i < 6; ++$i) {
$viewers[$i] = new WebChartViewer("chart$i");
createChart($viewers[$i], $i);
}
?>
<!DOCTYPE html>
<html>
<head>
<title>Black Vertical Bar Meters</title>
<!-- Include ChartDirector Javascript Library to support chart interactions -->
<script type="text/javascript" src="cdjcv.js"></script>
</head>
<body style="margin:5px 0px 0px 5px">
<div style="font:bold 18pt verdana;">
Black Vertical Bar Meters
</div>
<hr style="border:solid 1px #000080; background:#000080" />
<div style="font:10pt verdana; margin-bottom:1.5em">
<a href="viewsource.php?file=<?=basename(__FILE__)?>">View Chart Source Code</a>
</div>
<!-- ****** Here are the chart images ****** -->
<?php
for ($i = 0; $i < count($viewers); ++$i) {
echo $viewers[$i]->renderHTML(), " ";
}
?>
</body>
</html>