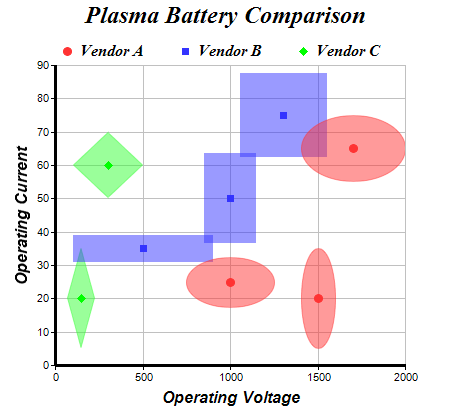
This example demonstrates a bubble chart with independent x and y bubble sizes and non-circular bubbles.
In ChartDirector, a bubble chart in general is a scatter layer with the symbol sizes controlled by some other data series.
ChartDirector supports using arbitrary symbols as bubbles. Thus bubble shape is not limited to circle but can be any shapes.
Furthermore, ChartDirector supports independent x and y sizes for bubbles. This is useful for creating charts in which the bubbles reflect some features of the data points, such as its confidence zone, x and y errors, x and y standard deviations, etc.
[File: phpdemo/bubblescale.php]
<?php
require_once("../lib/phpchartdir.php");

# The XY points for the bubble chart. The bubble chart has independent bubble size on the X and Y
# direction.
$dataX0 = array(1000, 1500, 1700);
$dataY0 = array(25, 20, 65);
$dataZX0 = array(500, 200, 600);
$dataZY0 = array(15, 30, 20);

$dataX1 = array(500, 1000, 1300);
$dataY1 = array(35, 50, 75);
$dataZX1 = array(800, 300, 500);
$dataZY1 = array(8, 27, 25);

$dataX2 = array(150, 300);
$dataY2 = array(20, 60);
$dataZX2 = array(160, 400);
$dataZY2 = array(30, 20);

# Create a XYChart object of size 450 x 420 pixels
$c = new XYChart(450, 420);

# Set the plotarea at (55, 65) and of size 350 x 300 pixels, with a light grey border (0xc0c0c0).
# Turn on both horizontal and vertical grid lines with light grey color (0xc0c0c0)
$c->setPlotArea(55, 65, 350, 300, -1, -1, 0xc0c0c0, 0xc0c0c0, -1);

# Add a legend box at (50, 30) (top of the chart) with horizontal layout. Use 12pt Times Bold Italic
# font. Set the background and border color to Transparent.
$c->addLegend(50, 30, false, "Times New Roman Bold Italic", 12)->setBackground(Transparent);

# Add a title to the chart using 18pt Times Bold Itatic font.
$c->addTitle("Plasma Battery Comparison", "Times New Roman Bold Italic", 18);

# Add titles to the axes using 12pt Arial Bold Italic font
$c->yAxis->setTitle("Operating Current", "Arial Bold Italic", 12);
$c->xAxis->setTitle("Operating Voltage", "Arial Bold Italic", 12);

# Set the axes line width to 3 pixels
$c->xAxis->setWidth(3);
$c->yAxis->setWidth(3);

# Add (dataX0, dataY0) as a standard scatter layer, and also as a "bubble" scatter layer, using
# circles as symbols. The "bubble" scatter layer has symbol size modulated by (dataZX0, dataZY0)
# using the scale on the x and y axes.
$c->addScatterLayer($dataX0, $dataY0, "Vendor A", CircleSymbol, 9, 0xff3333, 0xff3333);
$c->addScatterLayer($dataX0, $dataY0, "", CircleSymbol, 9, 0x80ff3333, 0x80ff3333)->setSymbolScale(
    $dataZX0, XAxisScale, $dataZY0, YAxisScale);

# Add (dataX1, dataY1) as a standard scatter layer, and also as a "bubble" scatter layer, using
# squares as symbols. The "bubble" scatter layer has symbol size modulated by (dataZX1, dataZY1)
# using the scale on the x and y axes.
$c->addScatterLayer($dataX1, $dataY1, "Vendor B", SquareSymbol, 7, 0x3333ff, 0x3333ff);
$c->addScatterLayer($dataX1, $dataY1, "", SquareSymbol, 9, 0x803333ff, 0x803333ff)->setSymbolScale(
    $dataZX1, XAxisScale, $dataZY1, YAxisScale);

# Add (dataX2, dataY2) as a standard scatter layer, and also as a "bubble" scatter layer, using
# diamonds as symbols. The "bubble" scatter layer has symbol size modulated by (dataZX2, dataZY2)
# using the scale on the x and y axes.
$c->addScatterLayer($dataX2, $dataY2, "Vendor C", DiamondSymbol, 9, 0x00ff00, 0x00ff00);
$c->addScatterLayer($dataX2, $dataY2, "", DiamondSymbol, 9, 0x8033ff33, 0x8033ff33)->setSymbolScale(
    $dataZX2, XAxisScale, $dataZY2, YAxisScale);

# Output the chart
$viewer = new WebChartViewer("chart1");
$viewer->setChart($c, SVG);

# Include tool tip for the chart
$viewer->setImageMap($c->getHTMLImageMap("", "",
    "title='Voltage = {x} +/- {={zx}/2} V, Current = {value} +/- {={zy}/2} A'"));
?>

<!DOCTYPE html>
<html>
<head>
    <title>Bubble XY Scaling</title>
    <!-- Include ChartDirector Javascript Library to support chart interactions -->
    <script type="text/javascript" src="cdjcv.js"></script>
</head>
<body style="margin:5px 0px 0px 5px">
    <div style="font:bold 18pt verdana;">
        Bubble XY Scaling
    </div>
    <hr style="border:solid 1px #000080; background:#000080" />
    <div style="font:10pt verdana; margin-bottom:1.5em">
        <a href="viewsource.php?file=<?=basename(__FILE__)?>">View Chart Source Code</a>
    </div>
    <!-- ****** Here is the chart image ****** -->
    <?php echo $viewer->renderHTML(); ?>
</body>
</html>
© 2022 Advanced Software Engineering Limited. All rights reserved.