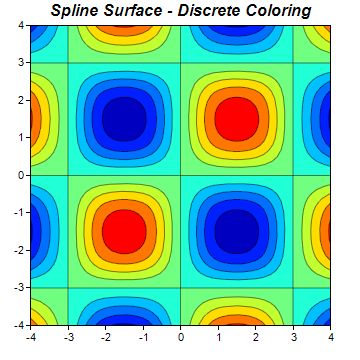
This example demonstrates spline and linear surface interpolation, and discrete and continuous coloring for the
ContourLayer.
The input to the contour layer are the z values at certain (x, y) points. To draw the contour and to color the layer, it is necessarily to know the z values at all pixels in the xy plane. ChartDirector uses surface interpolation to compute the z values at all pixels from the given data points. Two types of interpolation - spline and linear - are supported. They can be configured using
ContourLayer.setSmoothInterpolation.
The coloring of the contour layer can be discrete or continuous, configurable using
ColorAxis.setColorGradient or
ColorAxis.setColorScale.
[File: phpdemo/contourinterpolate.php]
<?php
require_once("../lib/phpchartdir.php");
function createChart($viewer, $chartIndex)
{
# The x and y coordinates of the grid
$dataX = array(-4, -3, -2, -1, 0, 1, 2, 3, 4);
$dataY = array(-4, -3, -2, -1, 0, 1, 2, 3, 4);
# The values at the grid points. In this example, we will compute the values using the formula z
# = Sin(x * pi / 3) * Sin(y * pi / 3).
$dataZ = array_fill(0, count($dataX) * count($dataY), 0);
for($yIndex = 0; $yIndex < count($dataY); ++$yIndex) {
$y = $dataY[$yIndex];
for($xIndex = 0; $xIndex < count($dataX); ++$xIndex) {
$x = $dataX[$xIndex];
$dataZ[$yIndex * count($dataX) + $xIndex] = sin($x * 3.1416 / 3) * sin($y * 3.1416 / 3);
}
}
# Create a XYChart object of size 360 x 360 pixels
$c = new XYChart(360, 360);
# Set the plotarea at (30, 25) and of size 300 x 300 pixels. Use semi-transparent black
# (c0000000) for both horizontal and vertical grid lines
$c->setPlotArea(30, 25, 300, 300, -1, -1, -1, 0xc0000000, -1);
# Add a contour layer using the given data
$layer = $c->addContourLayer($dataX, $dataY, $dataZ);
# Set the x-axis and y-axis scale
$c->xAxis->setLinearScale(-4, 4, 1);
$c->yAxis->setLinearScale(-4, 4, 1);
if ($chartIndex == 0) {
# Discrete coloring, spline surface interpolation
$c->addTitle("Spline Surface - Discrete Coloring", "Arial Bold Italic", 12);
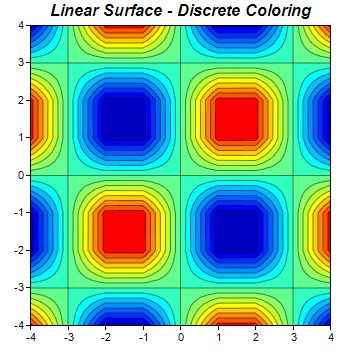
} else if ($chartIndex == 1) {
# Discrete coloring, linear surface interpolation
$c->addTitle("Linear Surface - Discrete Coloring", "Arial Bold Italic", 12);
$layer->setSmoothInterpolation(false);
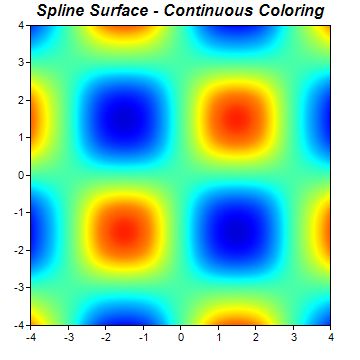
} else if ($chartIndex == 2) {
# Smooth coloring, spline surface interpolation
$c->addTitle("Spline Surface - Continuous Coloring", "Arial Bold Italic", 12);
$layer->setContourColor(Transparent);
$layer->colorAxis->setColorGradient(true);
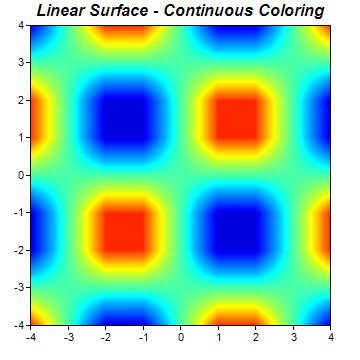
} else {
# Discrete coloring, linear surface interpolation
$c->addTitle("Linear Surface - Continuous Coloring", "Arial Bold Italic", 12);
$layer->setSmoothInterpolation(false);
$layer->setContourColor(Transparent);
$layer->colorAxis->setColorGradient(true);
}
# Output the chart
$viewer->setChart($c, SVG);
}
# This example includes 4 charts
$viewers = array();
for ($i = 0; $i < 4; ++$i) {
$viewers[$i] = new WebChartViewer("chart$i");
createChart($viewers[$i], $i);
}
?>
<!DOCTYPE html>
<html>
<head>
<title>Contour Interpolation</title>
<!-- Include ChartDirector Javascript Library to support chart interactions -->
<script type="text/javascript" src="cdjcv.js"></script>
</head>
<body style="margin:5px 0px 0px 5px">
<div style="font:bold 18pt verdana;">
Contour Interpolation
</div>
<hr style="border:solid 1px #000080; background:#000080" />
<div style="font:10pt verdana; margin-bottom:1.5em">
<a href="viewsource.php?file=<?=basename(__FILE__)?>">View Chart Source Code</a>
</div>
<!-- ****** Here are the chart images ****** -->
<?php
for ($i = 0; $i < count($viewers); ++$i) {
echo $viewers[$i]->renderHTML(), " ";
}
?>
</body>
</html>
© 2022 Advanced Software Engineering Limited. All rights reserved.