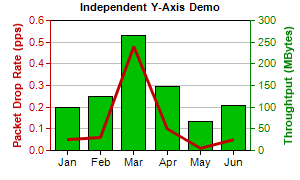
This example demonstrates a chart with two independent y-axis.
ChartDirector supports arbitrary number of axes. The first two x and y axes are most commonly used and can be retrieved using
XYChart.xAxis,
XYChart.xAxis2,
XYChart.yAxis and
XYChart.yAxis2. These axes are by default put at the edges of the plot area.
By default, a data set will bind to the primary y-axis. This can be modified by using
DataSet.setUseYAxis or
DataSet.setUseYAxis2.
The y-axes in this example are of different colors. This is achieved by using
Axis.setColors.
[File: phpdemo/dualyaxis.php]
<?php
require_once("../lib/phpchartdir.php");

# The data for the chart
$data0 = array(0.05, 0.06, 0.48, 0.1, 0.01, 0.05);
$data1 = array(100, 125, 265, 147, 67, 105);
$labels = array("Jan", "Feb", "Mar", "Apr", "May", "Jun");

# Create a XYChart object of size 300 x 180 pixels
$c = new XYChart(300, 180);

# Set the plot area at (50, 20) and of size 200 x 130 pixels
$c->setPlotArea(50, 20, 200, 130);

# Add a title to the chart using 8pt Arial Bold font
$c->addTitle("Independent Y-Axis Demo", "Arial Bold", 8);

# Set the labels on the x axis.
$c->xAxis->setLabels($labels);

# Add a title to the primary (left) y axis
$c->yAxis->setTitle("Packet Drop Rate (pps)");

# Set the axis, label and title colors for the primary y axis to red (0xc00000) to match the first
# data set
$c->yAxis->setColors(0xc00000, 0xc00000, 0xc00000);

# Add a title to the secondary (right) y axis
$c->yAxis2->setTitle("Throughtput (MBytes)");

# set the axis, label and title colors for the primary y axis to green (0x008000) to match the
# second data set
$c->yAxis2->setColors(0x008000, 0x008000, 0x008000);

# Add a line layer to for the first data set using red (0xc00000) color with a line width to 3
# pixels
$lineLayer = $c->addLineLayer($data0, 0xc00000);
$lineLayer->setLineWidth(3);

# tool tip for the line layer
$lineLayer->setHTMLImageMap("", "", "title='Packet Drop Rate on {xLabel}: {value} pps'");

# Add a bar layer to for the second data set using green (0x00C000) color. Bind the second data set
# to the secondary (right) y axis
$barLayer = $c->addBarLayer($data1, 0x00c000);
$barLayer->setUseYAxis2();

# tool tip for the bar layer
$barLayer->setHTMLImageMap("", "", "title='Throughput on {xLabel}: {value} MBytes'");

# Output the chart
$viewer = new WebChartViewer("chart1");
$viewer->setChart($c, SVG);

# include tool tip for the chart
$viewer->setImageMap($c->getHTMLImageMap(""));
?>

<!DOCTYPE html>
<html>
<head>
    <title>Dual Y-Axis</title>
    <!-- Include ChartDirector Javascript Library to support chart interactions -->
    <script type="text/javascript" src="cdjcv.js"></script>
</head>
<body style="margin:5px 0px 0px 5px">
    <div style="font:bold 18pt verdana;">
        Dual Y-Axis
    </div>
    <hr style="border:solid 1px #000080; background:#000080" />
    <div style="font:10pt verdana; margin-bottom:1.5em">
        <a href="viewsource.php?file=<?=basename(__FILE__)?>">View Chart Source Code</a>
    </div>
    <!-- ****** Here is the chart image ****** -->
    <?php echo $viewer->renderHTML(); ?>
</body>
</html>
© 2022 Advanced Software Engineering Limited. All rights reserved.