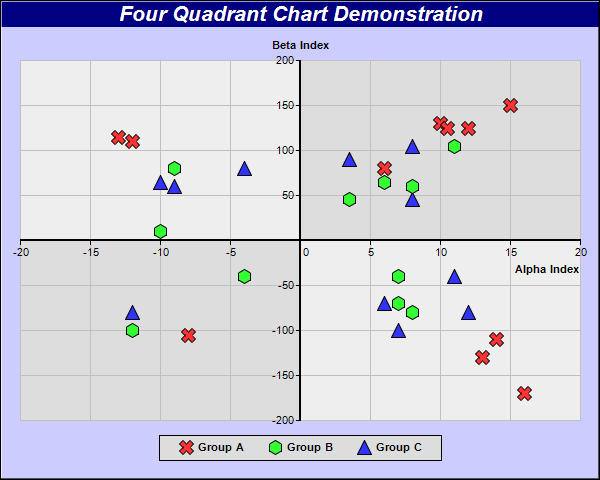
This example demonstrates 4 quadrant charts in which the x-axis and y-axis meet at the origin at the center of the plot area.
By default, ChartDirector puts the axes at the border of the plot area. This avoids the axis labels and the chart contents from overlapping and making the chart hard to read.
In some cases, it may be desirable to have one or both axes to intersect with the zero point of the other axis, where the zero point can be inside the plot area. In ChartDirector, these kinds of axis configurations may be set up with
XYChart.setAxisAtOrigin.
This example also demonstrates using
PlotArea.set4QBgColor to specify 4 background colors for the 4 quadrants.
[File: phpdemo/fourq.php]
<?php
require_once("../lib/phpchartdir.php");

# XY points for the scatter chart
$dataX0 = array(10, 15, 6, -12, 14, -8, 13, -13, 16, 12, 10.5);
$dataY0 = array(130, 150, 80, 110, -110, -105, -130, 115, -170, 125, 125);

$dataX1 = array(6, 7, -4, 3.5, 7, 8, -9, -10, -12, 11, 8);
$dataY1 = array(65, -40, -40, 45, -70, -80, 80, 10, -100, 105, 60);

$dataX2 = array(-10, -12, 11, 8, 6, 12, -4, 3.5, 7, 8, -9);
$dataY2 = array(65, -80, -40, 45, -70, -80, 80, 90, -100, 105, 60);

# Create a XYChart object of size 600 x 300 pixels, with a light blue (ccccff) background, a black
# border, and 1 pixel 3D border effect
$c = new XYChart(600, 480, 0xccccff, 0x000000, 1);

# Add a title box to the chart using 16pt Arial Bold Italic font, with white text on deep blue
# background
$c->addTitle("Four Quadrant Chart Demonstration", "Arial Bold Italic", 16, 0xffffff)->setBackground(
    0x000080);

# Set the plotarea at (20, 60) and of size 560 x 360 pixels, with grey (808080) border, and light
# grey (c0c0c0) horizontal and vertical grid lines. Set 4 quadrant coloring, where the colors of the
# quadrants alternate between lighter and deeper grey (dddddd/eeeeee)
$c->setPlotArea(20, 60, 560, 360, -1, -1, 0x808080, 0xc0c0c0, 0xc0c0c0)->set4QBgColor(0xdddddd,
    0xeeeeee, 0xdddddd, 0xeeeeee);

# Set 4 quadrant mode, with both x and y axes symetrical around the origin
$c->setAxisAtOrigin(XYAxisAtOrigin, XAxisSymmetric + YAxisSymmetric);

# Add a legend box at (300, 460) (bottom center of the chart) with horizontal layout. Use 8pt Arial
# Bold font.
$legendBox = $c->addLegend(300, 460, false, "Arial Bold", 8);
$legendBox->setAlignment(BottomCenter);

# Set legend box background to light grey (dddddd) with a black border
$legendBox->setBackground(0xdddddd, 0);

# Set left/right margin to 20 pixels and top/bottom margin to 5 pixels
$legendBox->setMargin2(20, 20, 5, 5);

# Add a titles to axes
$c->xAxis->setTitle("Alpha Index");
$c->yAxis->setTitle("Beta Index");

# Set axes width to 2 pixels
$c->xAxis->setWidth(2);
$c->yAxis->setWidth(2);

# Add scatter layer, using 15 pixels red (ff33333) X shape symbols
$c->addScatterLayer($dataX0, $dataY0, "Group A", Cross2Shape(), 15, 0xff3333);

# Add scatter layer, using 15 pixels green (33ff33) 6-sided polygon symbols
$c->addScatterLayer($dataX1, $dataY1, "Group B", PolygonShape(6), 15, 0x33ff33);

# Add scatter layer, using 15 pixels blue (3333ff) triangle symbols
$c->addScatterLayer($dataX2, $dataY2, "Group C", TriangleSymbol, 15, 0x3333ff);

# Output the chart
$viewer = new WebChartViewer("chart1");
$viewer->setChart($c, SVG);

# Include tool tip for the chart
$viewer->setImageMap($c->getHTMLImageMap("", "",
    "title='[{dataSetName}] Alpha = {x}, Beta = {value}'"));
?>

<!DOCTYPE html>
<html>
<head>
    <title>4 Quadrant Chart</title>
    <!-- Include ChartDirector Javascript Library to support chart interactions -->
    <script type="text/javascript" src="cdjcv.js"></script>
</head>
<body style="margin:5px 0px 0px 5px">
    <div style="font:bold 18pt verdana;">
        4 Quadrant Chart
    </div>
    <hr style="border:solid 1px #000080; background:#000080" />
    <div style="font:10pt verdana; margin-bottom:1.5em">
        <a href="viewsource.php?file=<?=basename(__FILE__)?>">View Chart Source Code</a>
    </div>
    <!-- ****** Here is the chart image ****** -->
    <?php echo $viewer->renderHTML(); ?>
</body>
</html>
© 2022 Advanced Software Engineering Limited. All rights reserved.