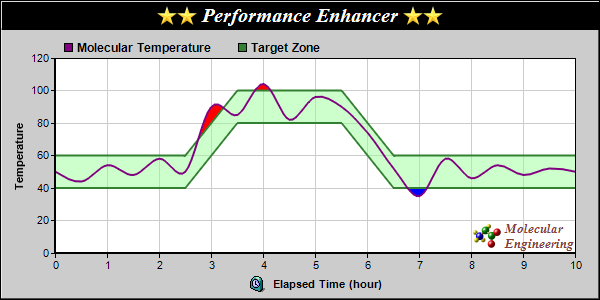
This example demonstrates filling the area between two lines or curves, as well as a number of advanced chart formatting techniques.
ChartDirector supports filling the area between two lines. The lines can be from a
LineLayer,
SplineLayer,
StepLineLayer,
TrendLayer or from an axis
Mark. Two colors can be used for filling, depending on which line is on top.
The effects in this example is achieved using the following methods:
[File: phpdemo/linecompare.php]
<?php
require_once("../lib/phpchartdir.php");

# The data for the upper and lower bounding lines
$upperY = array(60, 60, 100, 100, 60, 60);
$lowerY = array(40, 40, 80, 80, 40, 40);
$zoneX = array(0, 2.5, 3.5, 5.5, 6.5, 10);

# The data for the spline curve
$curveY = array(50, 44, 54, 48, 58, 50, 90, 85, 104, 82, 96, 90, 74, 52, 35, 58, 46, 54, 48, 52, 50)
    ;
$curveX = array(0, 0.5, 1, 1.5, 2, 2.5, 3, 3.5, 4, 4.5, 5, 5.5, 6, 6.5, 7, 7.5, 8, 8.5, 9, 9.5, 10);

# Create a XYChart object of size 600 x 300 pixels, with a light grey (cccccc) background, black
# border, and 1 pixel 3D border effect.
$c = new XYChart(600, 300, 0xcccccc, 0x000000, 1);

# Set directory for loading images to current script directory
# Need when running under Microsoft IIS
$c->setSearchPath(dirname(__FILE__));

# Set the plotarea at (55, 58) and of size 520 x 195 pixels, with white background. Turn on both
# horizontal and vertical grid lines with light grey color (cccccc)
$c->setPlotArea(55, 58, 520, 195, 0xffffff, -1, -1, 0xcccccc, 0xcccccc);

# Add a legend box at (55, 32) (top of the chart) with horizontal layout. Use 9pt Arial Bold font.
# Set the background and border color to Transparent.
$c->addLegend(55, 32, false, "Arial Bold", 9)->setBackground(Transparent);

# Add a title box to the chart using 15pt Times Bold Italic font. The title is in CDML and includes
# embedded images for highlight. The text is white (ffffff) on a black background, with a 1 pixel 3D
# border.
$c->addTitle(
    "<*block,valign=absmiddle*><*img=star.png*><*img=star.png*> Performance Enhancer ".
    "<*img=star.png*><*img=star.png*><*/*>", "Times New Roman Bold Italic", 15, 0xffffff
    )->setBackground(0x000000, -1, 1);

# Add a title to the y axis
$c->yAxis->setTitle("Temperature");

# Add a title to the x axis using CMDL
$c->xAxis->setTitle("<*block,valign=absmiddle*><*img=clock.png*>  Elapsed Time (hour)<*/*>");

# Set the axes width to 2 pixels
$c->xAxis->setWidth(2);
$c->yAxis->setWidth(2);

# Add a purple (800080) spline layer to the chart with a line width of 2 pixels
$splineLayer = $c->addSplineLayer($curveY, 0x800080, "Molecular Temperature");
$splineLayer->setXData($curveX);
$splineLayer->setLineWidth(2);

# Add a line layer to the chart with two dark green (338033) data sets, and a line width of 2 pixels
$lineLayer = $c->addLineLayer2();
$lineLayer->addDataSet($upperY, 0x338033, "Target Zone");
$lineLayer->addDataSet($lowerY, 0x338033);
$lineLayer->setXData($zoneX);
$lineLayer->setLineWidth(2);

# Color the zone between the upper zone line and lower zone line as semi-transparent light green
# (8099ff99)
$c->addInterLineLayer($lineLayer->getLine(0), $lineLayer->getLine(1), 0x8099ff99, 0x8099ff99);

# If the spline line gets above the upper zone line, color to area between the lines red (ff0000)
$c->addInterLineLayer($splineLayer->getLine(0), $lineLayer->getLine(0), 0xff0000, Transparent);

# If the spline line gets below the lower zone line, color to area between the lines blue (0000ff)
$c->addInterLineLayer($splineLayer->getLine(0), $lineLayer->getLine(1), Transparent, 0x0000ff);

# Add a custom CDML text at the bottom right of the plot area as the logo
$c->addText(575, 250,
    "<*block,valign=absmiddle*><*img=small_molecule.png*> <*block*><*font=Times New Roman Bold ".
    "Italic,size=10,color=804040*>Molecular\nEngineering<*/*>")->setAlignment(BottomRight);

# Output the chart
$viewer = new WebChartViewer("chart1");
$viewer->setChart($c, SVG);

# Include tool tip for the chart
$viewer->setImageMap($c->getHTMLImageMap("", "", "title='Temperature at hour {x}: {value} C'"));
?>

<!DOCTYPE html>
<html>
<head>
    <title>Line with Target Zone</title>
    <!-- Include ChartDirector Javascript Library to support chart interactions -->
    <script type="text/javascript" src="cdjcv.js"></script>
</head>
<body style="margin:5px 0px 0px 5px">
    <div style="font:bold 18pt verdana;">
        Line with Target Zone
    </div>
    <hr style="border:solid 1px #000080; background:#000080" />
    <div style="font:10pt verdana; margin-bottom:1.5em">
        <a href="viewsource.php?file=<?=basename(__FILE__)?>">View Chart Source Code</a>
    </div>
    <!-- ****** Here is the chart image ****** -->
    <?php echo $viewer->renderHTML(); ?>
</body>
</html>
© 2022 Advanced Software Engineering Limited. All rights reserved.