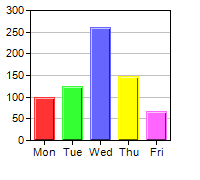
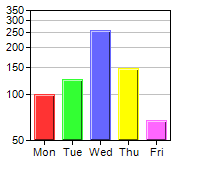
This example demonstrates using a log scale axis versus a linear scale axis.
In ChartDirector, log scale axis can be configured using Axis.setLogScale, Axis.setLogScale2 or Axis.setLogScale3.
ChartDirector 7.0 (PHP Edition)
Log Scale Axis
Source Code Listing
<?php
require_once("../lib/phpchartdir.php");

function createChart($viewer, $chartIndex)
{
    # The data for the chart
    $data = array(100, 125, 260, 147, 67);
    $labels = array("Mon", "Tue", "Wed", "Thu", "Fri");

    # Create a XYChart object of size 200 x 180 pixels
    $c = new XYChart(200, 180);

    # Set the plot area at (30, 10) and of size 140 x 130 pixels
    $c->setPlotArea(30, 10, 140, 130);

    # Ise log scale axis if required
    if ($chartIndex == 1) {
        $c->yAxis->setLogScale3();
    }

    # Set the labels on the x axis
    $c->xAxis->setLabels($labels);

    # Add a color bar layer using the given data. Use a 1 pixel 3D border for the bars.
    $c->addBarLayer3($data)->setBorderColor(-1, 1);

    # Output the chart
    $viewer->setChart($c, SVG);

    # Include tool tip for the chart
    $viewer->setImageMap($c->getHTMLImageMap("", "", "title='Mileage on {xLabel}: {value} miles'"));
}

# This example includes 2 charts
$viewers = array();
for ($i = 0; $i < 2; ++$i) {
    $viewers[$i] = new WebChartViewer("chart$i");
    createChart($viewers[$i], $i);
}
?>

<!DOCTYPE html>
<html>
<head>
    <title>Log Scale Axis</title>
    <!-- Include ChartDirector Javascript Library to support chart interactions -->
    <script type="text/javascript" src="cdjcv.js"></script>
</head>
<body style="margin:5px 0px 0px 5px">
    <div style="font:bold 18pt verdana;">
        Log Scale Axis
    </div>
    <hr style="border:solid 1px #000080; background:#000080" />
    <div style="font:10pt verdana; margin-bottom:1.5em">
        <a href="viewsource.php?file=<?=basename(__FILE__)?>">View Chart Source Code</a>
    </div>
    <!-- ****** Here are the chart images ****** -->
    <?php
        for ($i = 0; $i < count($viewers); ++$i) {
            echo $viewers[$i]->renderHTML(), " ";
        }
    ?>
</body>
</html>