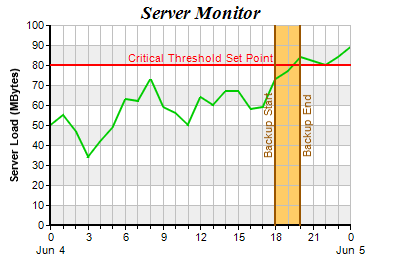
This example demonstrates adding marks and zones to the chart, and positioning mark labels.
The chart in the example consists of three mark lines (one horizontal and two vertical) and one vertical zone. The mark lines are created using
Axis.addMark. The zone is created using
Axis.addZone.
By default, mark labels will be drawn as axis labels. In this example, the label of the red mark line is moved to the top center of the mark line using
TextBox.setAlignment with
TopCenter alignment.
Similarly, the labels for the brown mark lines are moved to the left and right sides of the mark lines, with the text rotated by 90 degrees. This is achieved by using
TextBox.setAlignment with
Left and
Right alignments, and using
TextBox.setFontAngle.
[File: phpdemo/markzone2.php]
<?php
require_once("../lib/phpchartdir.php");

# The data for the chart
$data = array(50, 55, 47, 34, 42, 49, 63, 62, 73, 59, 56, 50, 64, 60, 67, 67, 58, 59, 73, 77, 84,
    82, 80, 84, 89);

# The labels for the chart. Note the "-" means a minor tick.
$labels = array("0\nJun 4", "1", "2", "3", "4", "5", "6", "7", "8", "9", "10", "11", "12", "13",
    "14", "15", "16", "17", "18", "19", "20", "21", "22", "23", "0\nJun 5");

# Create a XYChart object of size 400 x 270 pixels
$c = new XYChart(400, 270);

# Set the plotarea at (80, 25) and of size 300 x 200 pixels. Use alternate color background
# (0xeeeeee) and (0xffffff). Set border and grid colors to grey (0xc0c0c0).
$c->setPlotArea(50, 25, 300, 200, 0xeeeeee, 0xffffff, 0xc0c0c0, 0xc0c0c0, 0xc0c0c0);

# Add a title to the chart using 14pt Times Bold Italic font
$c->addTitle("Server Monitor", "Times New Roman Bold Italic", 14);

# Add a title to the y axis
$c->yAxis->setTitle("Server Load (MBytes)");

# Set the y axis width to 2 pixels
$c->yAxis->setWidth(2);

# Set the labels on the x axis.
$c->xAxis->setLabels($labels);

# Display 1 out of 3 labels on the x-axis. Show minor ticks for remaining labels.
$c->xAxis->setLabelStep(3, 1);

# Set the x axis width to 2 pixels
$c->xAxis->setWidth(2);

# Add a horizontal red (0x800080) mark line at y = 80
$yMark = $c->yAxis->addMark(80, 0xff0000, "Critical Threshold Set Point");

# Set the mark line width to 2 pixels
$yMark->setLineWidth(2);

# Put the mark label at the top center of the mark line
$yMark->setAlignment(TopCenter);

# Add an orange (0xffcc66) zone from x = 18 to x = 20
$c->xAxis->addZone(18, 20, 0xffcc66);

# Add a vertical brown (0x995500) mark line at x = 18
$xMark1 = $c->xAxis->addMark(18, 0x995500, "Backup Start");

# Set the mark line width to 2 pixels
$xMark1->setLineWidth(2);

# Put the mark label at the left of the mark line
$xMark1->setAlignment(Left);

# Rotate the mark label by 90 degrees so it draws vertically
$xMark1->setFontAngle(90);

# Add a vertical brown (0x995500) mark line at x = 20
$xMark2 = $c->xAxis->addMark(20, 0x995500, "Backup End");

# Set the mark line width to 2 pixels
$xMark2->setLineWidth(2);

# Put the mark label at the right of the mark line
$xMark2->setAlignment(Right);

# Rotate the mark label by 90 degrees so it draws vertically
$xMark2->setFontAngle(90);

# Add a green (0x00cc00) line layer with line width of 2 pixels
$c->addLineLayer($data, 0x00cc00)->setLineWidth(2);

# Output the chart
$viewer = new WebChartViewer("chart1");
$viewer->setChart($c, SVG);

# Include tool tip for the chart
$viewer->setImageMap($c->getHTMLImageMap("", "", "title='Load at {x}:00 = {value} MBytes'"));
?>

<!DOCTYPE html>
<html>
<head>
    <title>Marks and Zones (2)</title>
    <!-- Include ChartDirector Javascript Library to support chart interactions -->
    <script type="text/javascript" src="cdjcv.js"></script>
</head>
<body style="margin:5px 0px 0px 5px">
    <div style="font:bold 18pt verdana;">
        Marks and Zones (2)
    </div>
    <hr style="border:solid 1px #000080; background:#000080" />
    <div style="font:10pt verdana; margin-bottom:1.5em">
        <a href="viewsource.php?file=<?=basename(__FILE__)?>">View Chart Source Code</a>
    </div>
    <!-- ****** Here is the chart image ****** -->
    <?php echo $viewer->renderHTML(); ?>
</body>
</html>
© 2022 Advanced Software Engineering Limited. All rights reserved.