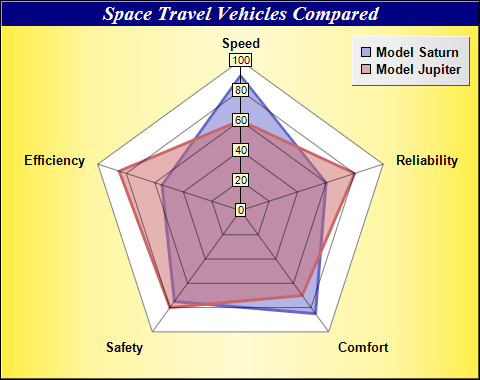
This example demonstrates a radar chart with two layers and a number of chart formatting effects.
[File: phpdemo/multiradar.php]
<?php
require_once("../lib/phpchartdir.php");

# The data for the chart
$data0 = array(90, 60, 85, 75, 55);
$data1 = array(60, 80, 70, 80, 85);

# The labels for the chart
$labels = array("Speed", "Reliability", "Comfort", "Safety", "Efficiency");

# Create a PolarChart object of size 480 x 380 pixels. Set background color to gold, with 1 pixel 3D
# border effect
$c = new PolarChart(480, 380, goldColor(), 0x000000, 1);

# Add a title to the chart using 15pt Times Bold Italic font. The title text is white (ffffff) on a
# deep blue (000080) background
$c->addTitle("Space Travel Vehicles Compared", "Times New Roman Bold Italic", 15, 0xffffff
    )->setBackground(0x000080);

# Set plot area center at (240, 210), with 150 pixels radius, and a white (ffffff) background.
$c->setPlotArea(240, 210, 150, 0xffffff);

# Add a legend box at top right corner (470, 35) using 10pt Arial Bold font. Set the background to
# silver, with 1 pixel 3D border effect.
$b = $c->addLegend(470, 35, true, "Arial Bold", 10);
$b->setAlignment(TopRight);
$b->setBackground(silverColor(), Transparent, 1);

# Add an area layer to the chart using semi-transparent blue (0x806666cc). Add a blue (0x6666cc)
# line layer using the same data with 3 pixel line width to highlight the border of the area.
$c->addAreaLayer($data0, 0x806666cc, "Model Saturn");
$c->addLineLayer($data0, 0x6666cc)->setLineWidth(3);

# Add an area layer to the chart using semi-transparent red (0x80cc6666). Add a red (0xcc6666) line
# layer using the same data with 3 pixel line width to highlight the border of the area.
$c->addAreaLayer($data1, 0x80cc6666, "Model Jupiter");
$c->addLineLayer($data1, 0xcc6666)->setLineWidth(3);

# Set the labels to the angular axis as spokes.
$c->angularAxis->setLabels($labels);

# Output the chart
$viewer = new WebChartViewer("chart1");
$viewer->setChart($c, SVG);

# Include tool tip for the chart
$viewer->setImageMap($c->getHTMLImageMap("", "", "title='[{dataSetName}] {label}: score = {value}'")
    );
?>

<!DOCTYPE html>
<html>
<head>
    <title>Multi Radar Chart</title>
    <!-- Include ChartDirector Javascript Library to support chart interactions -->
    <script type="text/javascript" src="cdjcv.js"></script>
</head>
<body style="margin:5px 0px 0px 5px">
    <div style="font:bold 18pt verdana;">
        Multi Radar Chart
    </div>
    <hr style="border:solid 1px #000080; background:#000080" />
    <div style="font:10pt verdana; margin-bottom:1.5em">
        <a href="viewsource.php?file=<?=basename(__FILE__)?>">View Chart Source Code</a>
    </div>
    <!-- ****** Here is the chart image ****** -->
    <?php echo $viewer->renderHTML(); ?>
</body>
</html>
© 2022 Advanced Software Engineering Limited. All rights reserved.