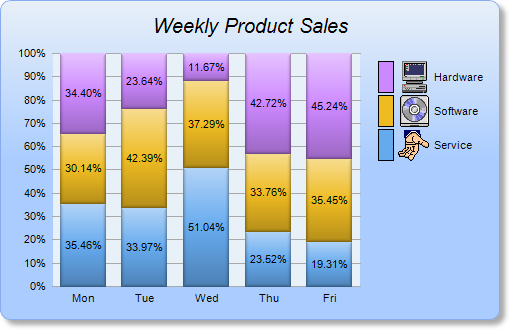
This example demonstrates creating a percentage bar chart with a legend box. It also demonstrates gradient background color, rounded frame, soft drop shadow, and using
CDML to include custom icons in the legend box.
A percentage bar chart is like a stacked bar chart, except the bars are individually scaled so that they stacked up to 100.
The key features demonstrated in this example are:
- The gradient background is achieved by using BaseChart.linearGradientColor to define the gradient color, then use BaseChart.setBackground to set it as the chart background color.
- The rounded frame is configured using BaseChart.setRoundedFrame.
- The soft drop shadow is configured using BaseChart.setDropShadow.
- The legend box is added using BaseChart.addLegend. The legend key (the color box to the right of each legend entry) is set to 16 x 32 pixels using LegendBox.setKeySize, so as to match the size of the custom icons.
- The ordering of the legend entries is reversed using Layer.setLegend, so that the legend box shows the last data set name first. This is useful for a vertical legend box in a vertical stacked chart with purely positive data. In such case, the last data set will be on the top of the stacked bars. Reversing the ordering of the legend entries will make it visually consistent with the stacking order of the data set.
- The percentage bar layer is added using XYChart.addBarLayer2 with the Percentage predefined constant.
- Multiple data sets are added to the bar layer using Layer.addDataSet. CDML is used to include custom icons in the data set names.
- Labels for the bar segments are added using Layer.setDataLabelStyle, with center alignment configured using TextBox.setAlignment.
- For web applications, we need to set the search path to load the icon images from the current script directory using BaseChart.setSearchPath. It is because for some web servers (eg. IIS), the default current directory is not the script directory (eg. IIS uses the IIS executable directory), so the search path needs to be set explicitly.
Note that by default, the data label format is
{percent}% (showing the percentage) for a percentage bar layer, as opposed to
{value} (showing the data value) for other types of bar layer. The data label format can be modified using
Layer.setDataLabelFormat.
[File: phpdemo/percentbar.php]
<?php
require_once("../lib/phpchartdir.php");

# The data for the bar chart
$data0 = array(100, 125, 245, 147, 67);
$data1 = array(85, 156, 179, 211, 123);
$data2 = array(97, 87, 56, 267, 157);

# The labels for the bar chart
$labels = array("Mon", "Tue", "Wed", "Thu", "Fri");

# Create a XYChart object of size 500 x 320 pixels. Use a vertical gradient color from pale blue
# (e8f0f8) to sky blue (aaccff) spanning half the chart height as background. Set border to blue
# (88aaee). Use rounded corners. Enable soft drop shadow.
$c = new XYChart(500, 320);
$c->setBackground($c->linearGradientColor(0, 0, 0, $c->getHeight() / 2, 0xe8f0f8, 0xaaccff),
    0x88aaee);
$c->setRoundedFrame();
$c->setDropShadow();

# Set directory for loading images to current script directory
# Need when running under Microsoft IIS
$c->setSearchPath(dirname(__FILE__));

# Add a title to the chart using 15 points Arial Italic. Set top/bottom margins to 15 pixels.
$title = $c->addTitle("Weekly Product Sales", "Arial Italic", 15);
$title->setMargin2(0, 0, 15, 15);

# Tentatively set the plotarea to 50 pixels from the left edge, and to just under the title. Set the
# width to 60% of the chart width, and the height to 50 pixels from the bottom edge. Use pale blue
# (e8f0f8) background, transparent border, and grey (aaaaaa) grid lines.
$c->setPlotArea(50, $title->getHeight(), $c->getWidth() * 6 / 10, $c->getHeight() -
    $title->getHeight() - 50, 0xe8f0f8, -1, Transparent, 0xaaaaaa);

# Add a legend box where the top-right corner is anchored at 10 pixels from the right edge, and just
# under the title. Use vertical layout and 8 points Arial font.
$legendBox = $c->addLegend($c->getWidth() - 10, $title->getHeight(), true, "Arial", 8);
$legendBox->setAlignment(TopRight);

# Set the legend box background and border to transparent
$legendBox->setBackground(Transparent, Transparent);

# Set the legend box icon size to 16 x 32 pixels to match with custom icon size
$legendBox->setKeySize(16, 32);

# Set axes to transparent
$c->xAxis->setColors(Transparent);
$c->yAxis->setColors(Transparent);

# Set the labels on the x axis
$c->xAxis->setLabels($labels);

# Add a percentage bar layer
$layer = $c->addBarLayer2(Percentage);

# Add the three data sets to the bar layer, using icons images with labels as data set names
$layer->addDataSet($data0, 0x66aaee, "<*block,valign=absmiddle*><*img=service.png*> Service<*/*>");
$layer->addDataSet($data1, 0xeebb22, "<*block,valign=absmiddle*><*img=software.png*> Software<*/*>")
    ;
$layer->addDataSet($data2, 0xcc88ff, "<*block,valign=absmiddle*><*img=computer.png*> Hardware<*/*>")
    ;

# Use soft lighting effect with light direction from top
$layer->setBorderColor(Transparent, softLighting(Top));

# Enable data label at the middle of the the bar
$layer->setDataLabelStyle()->setAlignment(Center);

# For a vertical stacked chart with positive data only, the last data set is always on top. However,
# in a vertical legend box, the last data set is at the bottom. This can be reversed by using the
# setLegend method.
$layer->setLegend(ReverseLegend);

# Adjust the plot area size, such that the bounding box (inclusive of axes) is 15 pixels from the
# left edge, just below the title, 10 pixels to the right of the legend box, and 15 pixels from the
# bottom edge.
$c->packPlotArea(15, $title->getHeight(), $c->layoutLegend()->getLeftX() - 10, $c->getHeight() - 15)
    ;

# Output the chart
$viewer = new WebChartViewer("chart1");
$viewer->setChart($c, SVG);

# Include tool tip for the chart
$viewer->setImageMap($c->getHTMLImageMap("", "",
    "title='{dataSetName} revenue on {xLabel}: US\${value}K ({percent}%)'"));
?>

<!DOCTYPE html>
<html>
<head>
    <title>Percentage Bar Chart</title>
    <!-- Include ChartDirector Javascript Library to support chart interactions -->
    <script type="text/javascript" src="cdjcv.js"></script>
</head>
<body style="margin:5px 0px 0px 5px">
    <div style="font:bold 18pt verdana;">
        Percentage Bar Chart
    </div>
    <hr style="border:solid 1px #000080; background:#000080" />
    <div style="font:10pt verdana; margin-bottom:1.5em">
        <a href="viewsource.php?file=<?=basename(__FILE__)?>">View Chart Source Code</a>
    </div>
    <!-- ****** Here is the chart image ****** -->
    <?php echo $viewer->renderHTML(); ?>
</body>
</html>
© 2022 Advanced Software Engineering Limited. All rights reserved.