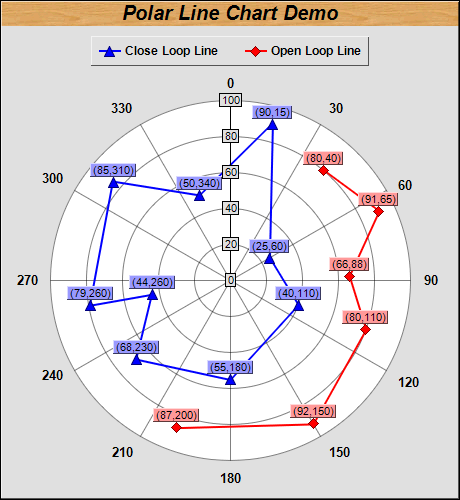
This example demonstrates a polar line chart, completed with data symbols and data labels.
[File: phpdemo/polarline.php]
<?php
require_once("../lib/phpchartdir.php");

# The data for the chart
$data0 = array(90, 25, 40, 55, 68, 44, 79, 85, 50);
$angles0 = array(15, 60, 110, 180, 230, 260, 260, 310, 340);

$data1 = array(80, 91, 66, 80, 92, 87);
$angles1 = array(40, 65, 88, 110, 150, 200);

# Create a PolarChart object of size 460 x 500 pixels, with a grey (e0e0e0) background and 1 pixel
# 3D border
$c = new PolarChart(460, 500, 0xe0e0e0, 0x000000, 1);

# Add a title to the chart at the top left corner using 15pt Arial Bold Italic font. Use a wood
# pattern as the title background.
$c->addTitle("Polar Line Chart Demo", "Arial Bold Italic", 15)->setBackground($c->patternColor(
    dirname(__FILE__)."/wood.png"));

# Set center of plot area at (230, 280) with radius 180 pixels, and white (ffffff) background.
$c->setPlotArea(230, 280, 180, 0xffffff);

# Set the grid style to circular grid, with grids below the chart layers
$c->setGridStyle(false, false);

# Add a legend box at top-center of plot area (230, 35) using horizontal layout. Use 10pt Arial Bold
# font, with 1 pixel 3D border effect.
$b = $c->addLegend(230, 35, false, "Arial Bold", 9);
$b->setAlignment(TopCenter);
$b->setBackground(Transparent, Transparent, 1);

# Set angular axis as 0 - 360, with a spoke every 30 units
$c->angularAxis->setLinearScale(0, 360, 30);

# Add a blue (0xff) line layer to the chart using (data0, angle0)
$layer0 = $c->addLineLayer($data0, 0x0000ff, "Close Loop Line");
$layer0->setAngles($angles0);

# Set the line width to 2 pixels
$layer0->setLineWidth(2);

# Use 11 pixel triangle symbols for the data points
$layer0->setDataSymbol(TriangleSymbol, 11);

# Enable data label and set its format
$layer0->setDataLabelFormat("({value},{angle})");

# Set the data label text box with light blue (0x9999ff) backgruond color and 1 pixel 3D border
# effect
$layer0->setDataLabelStyle()->setBackground(0x9999ff, Transparent, 1);

# Add a red (0xff0000) line layer to the chart using (data1, angle1)
$layer1 = $c->addLineLayer($data1, 0xff0000, "Open Loop Line");
$layer1->setAngles($angles1);

# Set the line width to 2 pixels
$layer1->setLineWidth(2);

# Use 11 pixel diamond symbols for the data points
$layer1->setDataSymbol(DiamondSymbol, 11);

# Set the line to open loop
$layer1->setCloseLoop(false);

# Enable data label and set its format
$layer1->setDataLabelFormat("({value},{angle})");

# Set the data label text box with light red (0xff9999) backgruond color and 1 pixel 3D border
# effect
$layer1->setDataLabelStyle()->setBackground(0xff9999, Transparent, 1);

# Output the chart
$viewer = new WebChartViewer("chart1");
$viewer->setChart($c, SVG);

# Include tool tip for the chart
$viewer->setImageMap($c->getHTMLImageMap("", "", "title='[{dataSetName}] ({radius}, {angle})'"));
?>

<!DOCTYPE html>
<html>
<head>
    <title>Polar Line Chart</title>
    <!-- Include ChartDirector Javascript Library to support chart interactions -->
    <script type="text/javascript" src="cdjcv.js"></script>
</head>
<body style="margin:5px 0px 0px 5px">
    <div style="font:bold 18pt verdana;">
        Polar Line Chart
    </div>
    <hr style="border:solid 1px #000080; background:#000080" />
    <div style="font:10pt verdana; margin-bottom:1.5em">
        <a href="viewsource.php?file=<?=basename(__FILE__)?>">View Chart Source Code</a>
    </div>
    <!-- ****** Here is the chart image ****** -->
    <?php echo $viewer->renderHTML(); ?>
</body>
</html>
© 2022 Advanced Software Engineering Limited. All rights reserved.