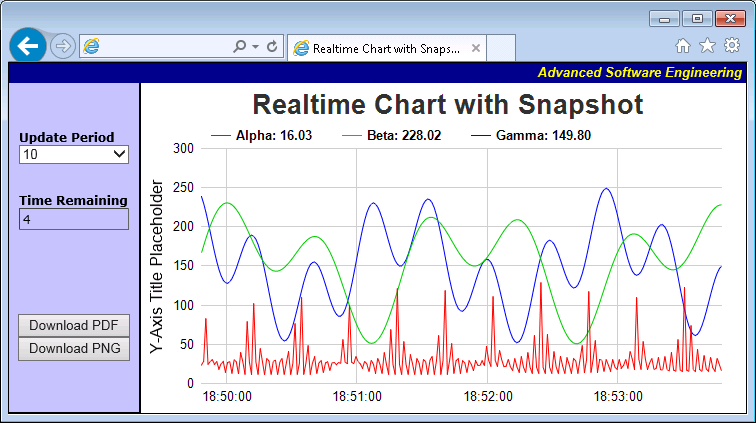
The example extends the
Simple Real-Time Chart example by adding buttons to download the chart in PNG and PDF formats.
When the button is pressed, the chart update request will include an extra query parameter specifying the download format. On the server side, the charting code will check if this parameter exists. If it does, the server code will return the chart as an attachment.
[File: phpdemo/realtimesnapshot.php]
<?php
require_once("../lib/phpchartdir.php");

#
# Data to draw the chart. In this demo, the data buffer will be filled by a random data generator.
# In real life, the data is probably stored in a buffer (eg. a database table, a text file, or some
# global memory) and updated by other means.
#

# We use a data buffer to emulate the last 240 samples.
$sampleSize = 240;
$dataSeries1 = array_fill(0, $sampleSize, 0);
$dataSeries2 = array_fill(0, $sampleSize, 0);
$dataSeries3 = array_fill(0, $sampleSize, 0);
$timeStamps = array_fill(0, $sampleSize, 0);

# Our pseudo random number generator
$firstDate = chartTime2(time()) - count($timeStamps);
for($i = 0; $i < count($timeStamps); ++$i) {
    $p = $firstDate + $i;
    $timeStamps[$i] = $p;
    $dataSeries1[$i] = cos($p * 2.1) * 10 + 1 / (cos($p) * cos($p) + 0.01) + 20;
    $dataSeries2[$i] = 100 * sin($p / 27.7) * sin($p / 10.1) + 150;
    $dataSeries3[$i] = 100 * cos($p / 6.7) * cos($p / 11.9) + 150;
}

# Create an XYChart object 600 x 320 pixels in size
$c = new XYChart(600, 320);

# Set the plotarea at (55, 60) and of size 520 x 235 pixels with transparent background and border.
# Enable both horizontal and vertical grids by setting their colors to grey (cccccc). Set clipping
# mode to clip the data lines to the plot area.
$c->setPlotArea(55, 60, 520, 235, -1, -1, Transparent, 0xcccccc, 0xcccccc);
$c->setClipping();

# Add a title to the chart using dark grey (0x333333) 20pt Arial Bold font
$c->addTitle("Real-Time Chart with Snapshot", "Arial Bold", 20, 0x333333);

# Add a legend box at the top of the plot area using horizontal layout. Use 10pt Arial Bold font,
# transparent background and border, and line style legend icon.
$b = $c->addLegend(55, 30, false, "Arial Bold", 10);
$b->setBackground(Transparent, Transparent);
$b->setLineStyleKey();

# Set the x and y axis stems to transparent and the label font to 10pt Arial
$c->xAxis->setColors(Transparent);
$c->yAxis->setColors(Transparent);
$c->xAxis->setLabelStyle("Arial", 10);
$c->yAxis->setLabelStyle("Arial", 10);

# Add y-axis title using 12pt Arial font
$c->yAxis->setTitle("Y-Axis Title Placeholder", "Arial", 12);

# For the automatic x and y axis labels, set the minimum spacing to 75 and 30 pixels.
$c->xAxis->setTickDensity(75);
$c->yAxis->setTickDensity(30);

# Set the x-axis label format
$c->xAxis->setLabelFormat("{value|hh:nn:ss}");

# Create a line layer to plot the lines
$layer = $c->addLineLayer2();

# The x-coordinates are the timeStamps.
$layer->setXData($timeStamps);

# The 3 data series are used to draw 3 lines. Here we put the latest data values as part of the data
# set name, so you can see them updated in the legend box.
$layer->addDataSet($dataSeries1, 0xff0000, $c->formatValue($dataSeries1[count($dataSeries1) - 1],
    "Alpha: {value|2}"));
$layer->addDataSet($dataSeries2, 0x00cc00, $c->formatValue($dataSeries2[count($dataSeries2) - 1],
    "Beta: {value|2}"));
$layer->addDataSet($dataSeries3, 0x0000ff, $c->formatValue($dataSeries3[count($dataSeries3) - 1],
    "Gamma: {value|2}"));

# Create the WebChartViewer to output the chart
$viewer = new WebChartViewer("ChartImage1");

# Check if is download request
$downloadFormat = isset($_REQUEST["download"]) ? $_REQUEST["download"] : null;
if (!(($downloadFormat == null) || ($downloadFormat == ""))) {
    $fname = "demo_" . $c->formatValue($timeStamps[count($timeStamps) - 1], "yyyymmddhhnnss");
    if ($downloadFormat == "pdf") {
        # Output in PDF and stream as attachment
        $viewer->streamAttachment($c->makeChart2(PDF), "$fname.pdf");
        exit();
    } else {
        # Output in PNG and stream as attachment
        $viewer->streamAttachment($c->makeChart2(PNG), "$fname.png");
        exit();
    }
}

# Check if is a stream request to update the chart
if ($viewer->isStreamRequest()) {
    # Stream the updated chart to the browser
    $viewer->streamChart($c->makeChart2(SVG));
    exit();
}

# Is the initial web page request. Output chart as usual.
$viewer->setChart($c, SVG);
?>

<!DOCTYPE html>
<html>
<head>
    <title>Real-Time Chart with Snapshot</title>
    <script type="text/javascript" src="cdjcv.js"></script>
</head>
<body style="margin:0px">
<table cellspacing="0" cellpadding="0" style="border:black 1px solid;">
    <tr>
        <td align="right" colspan="2" style="background:#000088; color:#ffff00; padding:0px 4px 2px 0px;">
            <a style="color:#FFFF00; font:italic bold 10pt Arial; text-decoration:none" href="http://www.advsofteng.com/">
                Advanced Software Engineering
            </a>
        </td>
    </tr>
    <tr valign="top">
        <td style="width:130px; background:#c0c0ff; border-right:black 1px solid; border-bottom:black 1px solid;">
            <br />
            <br />
            <div style="font:12px Verdana; padding:10px;">
                <b>Update Period</b><br />
                <select id="UpdatePeriod" style="width:110px">
                    <option value="5">5</option>
                    <option value="10" selected="selected">10</option>
                    <option value="20">20</option>
                    <option value="30">30</option>
                    <option value="60">60</option>
                </select>
                <br /><br /><br />
                <b>Time Remaining</b><br />
                <div style="width:108px; border:#888888 1px inset;">
                    <div style="margin:3px" id="TimeRemaining">0</div>
                </div>
            </div>
            <br />
            <br />
            <br />
            <br />
            <div style="text-align:center">
                <input type="button" value="Download PDF" style="width:112px; font:10pt Arial"
                    onclick="JsChartViewer.get('ChartImage1').partialUpdateAsAttachment('download=pdf');" /><br/>
                <input type="button" value="Download PNG" style="width:112px; font:10pt Arial; margin-top:8px;"
                    onclick="JsChartViewer.get('ChartImage1').partialUpdateAsAttachment('download=png');" />
            </div>
        </td>
        <td style="border-left:black 1px solid; padding:5px 0px 0px 5px;" >
            <!-- ****** Here is the chart image ****** -->
            <?php echo $viewer->renderHTML(); ?>
        </td>
    </tr>
</table>
<script type="text/javascript">

//
// Executes once every second to update the countdown display. Updates the chart when the countdown reaches 0.
//
function timerTick()
{
    // Get the update period and the time left
    var updatePeriod = parseInt(document.getElementById("UpdatePeriod").value);
    var timeLeft = Math.min(parseInt(document.getElementById("TimeRemaining").innerHTML), updatePeriod) - 1;

    if (timeLeft == 0)
        // Can update the chart now
        JsChartViewer.get('ChartImage1').streamUpdate();
    else if (timeLeft < 0)
        // Reset the update period
        timeLeft += updatePeriod;

    // Update the countdown display
    document.getElementById("TimeRemaining").innerHTML = timeLeft;
}
window.setInterval("timerTick()", 1000);

</script>
</body>
</html>
© 2022 Advanced Software Engineering Limited. All rights reserved.