[File: phpdemo/scattercontour.php]
<?php
require_once("../lib/phpchartdir.php");
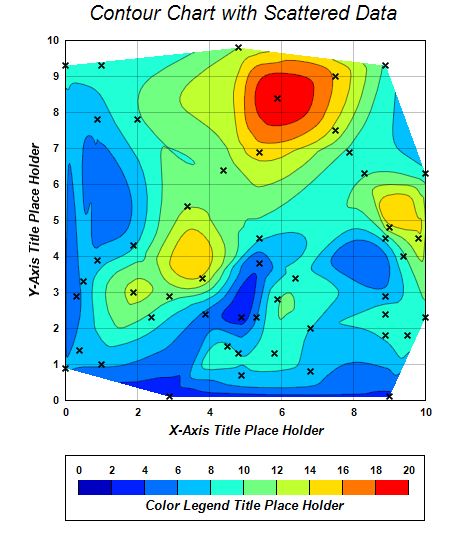
# The (x, y, z) coordinates of the scattered data
$dataX = array(0.5, 1.9, 4.9, 1.0, 8.9, 9.8, 5.9, 2.9, 6.8, 9.0, 0.0, 8.9, 1.9, 4.8, 2.4, 3.4, 7.9,
7.5, 4.8, 7.5, 9.5, 0.4, 8.9, 0.9, 5.4, 9.4, 2.9, 8.9, 0.9, 8.9, 10.0, 1.0, 6.8, 3.8, 9.0, 5.3,
6.4, 4.9, 4.5, 2.0, 5.4, 0.0, 10.0, 3.9, 5.4, 5.9, 5.8, 0.3, 4.4, 8.3);
$dataY = array(3.3, 3.0, 0.7, 1.0, 9.3, 4.5, 8.4, 0.1, 0.8, 0.1, 9.3, 1.8, 4.3, 1.3, 2.3, 5.4, 6.9,
9.0, 9.8, 7.5, 1.8, 1.4, 4.5, 7.8, 3.8, 4.0, 2.9, 2.4, 3.9, 2.9, 2.3, 9.3, 2.0, 3.4, 4.8, 2.3,
3.4, 2.3, 1.5, 7.8, 4.5, 0.9, 6.3, 2.4, 6.9, 2.8, 1.3, 2.9, 6.4, 6.3);
$dataZ = array(6.6, 12.5, 7.4, 6.2, 9.6, 13.6, 19.9, 2.2, 6.9, 3.4, 8.7, 8.4, 7.8, 8.0, 9.4, 11.9,
9.6, 15.7, 12.0, 13.3, 9.6, 6.4, 9.0, 6.9, 4.6, 9.7, 10.6, 9.2, 7.0, 6.9, 9.7, 8.6, 8.0, 13.6,
13.2, 5.9, 9.0, 3.2, 8.3, 9.7, 8.2, 6.1, 8.7, 5.6, 14.9, 9.8, 9.3, 5.1, 10.8, 9.8);
# Create a XYChart object of size 450 x 540 pixels
$c = new XYChart(450, 540);
# Add a title to the chart using 15 points Arial Italic font
$c->addTitle(" Contour Chart with Scattered Data", "Arial Italic", 15);
# Set the plotarea at (65, 40) and of size 360 x 360 pixels. Use semi-transparent black (c0000000)
# for both horizontal and vertical grid lines
$c->setPlotArea(65, 40, 360, 360, -1, -1, -1, 0xc0000000, -1);
# Set x-axis and y-axis title using 12 points Arial Bold Italic font
$c->xAxis->setTitle("X-Axis Title Place Holder", "Arial Bold Italic", 10);
$c->yAxis->setTitle("Y-Axis Title Place Holder", "Arial Bold Italic", 10);
# Set x-axis and y-axis labels to use Arial Bold font
$c->xAxis->setLabelStyle("Arial Bold");
$c->yAxis->setLabelStyle("Arial Bold");
# When x-axis and y-axis color to transparent
$c->xAxis->setColors(Transparent);
$c->yAxis->setColors(Transparent);
# Add a scatter layer to the chart to show the position of the data points. Disable the image map
# for the scatter layer. We will use the contour layer to provide the tooltip.
$c->addScatterLayer($dataX, $dataY, "", Cross2Shape(0.2), 7, 0x000000)->setHTMLImageMap("{disable}")
;
# Add a contour layer using the given data
$layer = $c->addContourLayer($dataX, $dataY, $dataZ);
# Move the grid lines in front of the contour layer
$c->getPlotArea()->moveGridBefore($layer);
# Add a color axis (the legend) in which the top center is anchored at (245, 455). Set the length to
# 330 pixels and the labels on the top side.
$cAxis = $layer->setColorAxis(245, 455, TopCenter, 330, Top);
# Add a bounding box to the color axis using the default line color as border.
$cAxis->setBoundingBox(Transparent, LineColor);
# Add a title to the color axis using 12 points Arial Bold Italic font
$cAxis->setTitle("Color Legend Title Place Holder", "Arial Bold Italic", 10);
# Set color axis labels to use Arial Bold font
$cAxis->setLabelStyle("Arial Bold");
# Set the color axis range as 0 to 20, with a step every 2 units
$cAxis->setLinearScale(0, 20, 2);
# Output the chart
$viewer = new WebChartViewer("chart1");
$viewer->setChart($c, SVG);
# Include CDML tool tip for the chart.
$viewer->setImageMap($c->getHTMLImageMap("", "",
"title='<*cdml*><*b*>X: {x|2}<*br*>Y: {y|2}<*br*>Z: {z|2}'"));
# Output Javascript chart model to support contour chart tooltips
$viewer->setChartModel($c->getJsChartModel())
?>
<!DOCTYPE html>
<html>
<head>
<title>Scattered Data Contour Chart</title>
<!-- Include ChartDirector Javascript Library to support chart interactions -->
<script type="text/javascript" src="cdjcv.js"></script>
</head>
<body style="margin:5px 0px 0px 5px">
<div style="font:bold 18pt verdana;">
Scattered Data Contour Chart
</div>
<hr style="border:solid 1px #000080; background:#000080" />
<div style="font:10pt verdana; margin-bottom:1.5em">
<a href="viewsource.php?file=<?=basename(__FILE__)?>">View Chart Source Code</a>
</div>
<!-- ****** Here is the chart image ****** -->
<?php echo $viewer->renderHTML(); ?>
</body>
</html>
© 2022 Advanced Software Engineering Limited. All rights reserved.