This example demonstrates the basic steps in creating bar charts.
[File: phpdemo/simplebar.php]
<?php
require_once("../lib/phpchartdir.php");
# The data for the bar chart
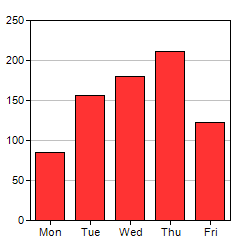
$data = array(85, 156, 179.5, 211, 123);
# The labels for the bar chart
$labels = array("Mon", "Tue", "Wed", "Thu", "Fri");
# Create a XYChart object of size 250 x 250 pixels
$c = new XYChart(250, 250);
# Set the plotarea at (30, 20) and of size 200 x 200 pixels
$c->setPlotArea(30, 20, 200, 200);
# Add a bar chart layer using the given data
$c->addBarLayer($data);
# Set the labels on the x axis.
$c->xAxis->setLabels($labels);
# Output the chart
$viewer = new WebChartViewer("chart1");
$viewer->setChart($c, SVG);
# Include tool tip for the chart
$viewer->setImageMap($c->getHTMLImageMap("", "", "title='{xLabel}: {value} GBytes'"));
?>
<!DOCTYPE html>
<html>
<head>
<title>Simple Bar Chart (1)</title>
<!-- Include ChartDirector Javascript Library to support chart interactions -->
<script type="text/javascript" src="cdjcv.js"></script>
</head>
<body style="margin:5px 0px 0px 5px">
<div style="font:bold 18pt verdana;">
Simple Bar Chart (1)
</div>
<hr style="border:solid 1px #000080; background:#000080" />
<div style="font:10pt verdana; margin-bottom:1.5em">
<a href="viewsource.php?file=<?=basename(__FILE__)?>">View Chart Source Code</a>
</div>
<!-- ****** Here is the chart image ****** -->
<?php echo $viewer->renderHTML(); ?>
</body>
</html>
© 2022 Advanced Software Engineering Limited. All rights reserved.