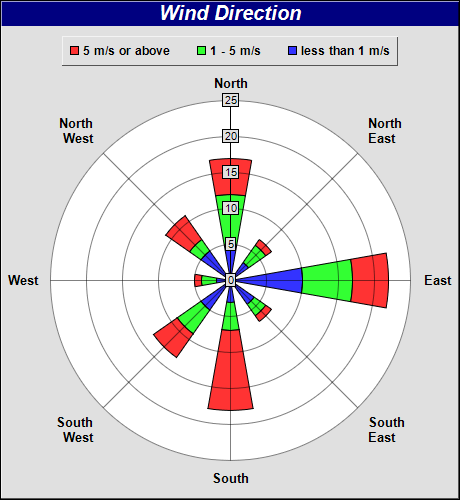
This example demonstrates how to create a stacked rose chart.
This example employs the same approach as the previous
Simple Rose Chart example. It creates a
PolarChart object as the graph paper, and adding sector zones on it using
AngularAxis.addZone. A transparent line layer is used for enabling auto-scaling.
In this example, multiple sectors are added for each angular direction, creating a "stacked" effect.
[File: phpdemo/stackrose.php]
<?php
require_once("../lib/phpchartdir.php");

# Data for the chart
$data0 = array(5, 3, 10, 4, 3, 5, 2, 5);
$data1 = array(12, 6, 17, 6, 7, 9, 4, 7);
$data2 = array(17, 7, 22, 7, 18, 13, 5, 11);

$angles = array(0, 45, 90, 135, 180, 225, 270, 315);
$labels = array("North", "North\nEast", "East", "South\nEast", "South", "South\nWest", "West",
    "North\nWest");

# Create a PolarChart object of size 460 x 500 pixels, with a grey (e0e0e0) background and a 1 pixel
# 3D border
$c = new PolarChart(460, 500, 0xe0e0e0, 0x000000, 1);

# Add a title to the chart at the top left corner using 15pt Arial Bold Italic font. Use white text
# on deep blue background.
$c->addTitle("Wind Direction", "Arial Bold Italic", 15, 0xffffff)->setBackground(0x000080);

$legendBox = $c->addLegend(230, 35, false, "Arial Bold", 9);
$legendBox->setAlignment(TopCenter);
$legendBox->setBackground(Transparent, Transparent, 1);

$legendBox->addKey("5 m/s or above", 0xff3333);
$legendBox->addKey("1 - 5 m/s", 0x33ff33);
$legendBox->addKey("less than 1 m/s", 0x3333ff);

# Set plot area center at (230, 280) with radius 180 pixels and white background
$c->setPlotArea(230, 280, 180, 0xffffff);

# Set the grid style to circular grid
$c->setGridStyle(false);

# Set angular axis as 0 - 360, with a spoke every 30 units
$c->angularAxis->setLinearScale2(0, 360, $labels);

for($i = 0; $i < count($angles); ++$i) {
    $c->angularAxis->addZone($angles[$i] - 10, $angles[$i] + 10, 0, $data0[$i], 0x3333ff, 0);
    $c->angularAxis->addZone($angles[$i] - 10, $angles[$i] + 10, $data0[$i], $data1[$i], 0x33ff33, 0
        );
    $c->angularAxis->addZone($angles[$i] - 10, $angles[$i] + 10, $data1[$i], $data2[$i], 0xff3333, 0
        );
}

# Add an Transparent invisible layer to ensure the axis is auto-scaled using the data
$c->addLineLayer($data2, Transparent);

# Output the chart
$viewer = new WebChartViewer("chart1");
$viewer->setChart($c, SVG);
?>

<!DOCTYPE html>
<html>
<head>
    <title>Stacked Rose Chart</title>
    <!-- Include ChartDirector Javascript Library to support chart interactions -->
    <script type="text/javascript" src="cdjcv.js"></script>
</head>
<body style="margin:5px 0px 0px 5px">
    <div style="font:bold 18pt verdana;">
        Stacked Rose Chart
    </div>
    <hr style="border:solid 1px #000080; background:#000080" />
    <div style="font:10pt verdana; margin-bottom:1.5em">
        <a href="viewsource.php?file=<?=basename(__FILE__)?>">View Chart Source Code</a>
    </div>
    <!-- ****** Here is the chart image ****** -->
    <?php echo $viewer->renderHTML(); ?>
</body>
</html>
© 2022 Advanced Software Engineering Limited. All rights reserved.