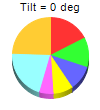
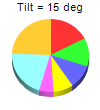
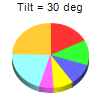
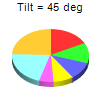
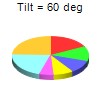
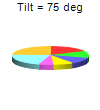

This example demonstrates the effects of different 3D angles.
ChartDirector allows the 3D depth and angles to be configured using
PieChart.set3D and
PieChart.set3D2.
This example also demonstrates how to disable sector labels. This is setting their colors to
Transparent using
PieChart.setLabelStyle.
[File: phpdemo/threedanglepie.php]
<?php
require_once("../lib/phpchartdir.php");

function createChart($viewer, $chartIndex)
{
    # the tilt angle of the pie
    $angle = $chartIndex * 15;

    # The data for the pie chart
    $data = array(25, 18, 15, 12, 8, 30, 35);

    # The labels for the pie chart
    $labels = array("Labor", "Licenses", "Taxes", "Legal", "Insurance", "Facilities", "Production");

    # Create a PieChart object of size 100 x 110 pixels
    $c = new PieChart(100, 110);

    # Set the center of the pie at (50, 55) and the radius to 38 pixels
    $c->setPieSize(50, 55, 38);

    # Set the depth and tilt angle of the 3D pie (-1 means auto depth)
    $c->set3D(-1, $angle);

    # Add a title showing the tilt angle
    $c->addTitle("Tilt = " . $angle . " deg", "Arial", 8);

    # Set the pie data
    $c->setData($data, $labels);

    # Disable the sector labels by setting the color to Transparent
    $c->setLabelStyle("", 8, Transparent);

    # Output the chart
    $viewer->setChart($c, SVG);

    # Include tool tip for the chart
    $viewer->setImageMap($c->getHTMLImageMap("", "", "title='{label}: US\${value}K ({percent}%)'"));
}

# This example includes 7 charts
$viewers = array();
for ($i = 0; $i < 7; ++$i) {
    $viewers[$i] = new WebChartViewer("chart$i");
    createChart($viewers[$i], $i);
}
?>

<!DOCTYPE html>
<html>
<head>
    <title>3D Angle</title>
    <!-- Include ChartDirector Javascript Library to support chart interactions -->
    <script type="text/javascript" src="cdjcv.js"></script>
</head>
<body style="margin:5px 0px 0px 5px">
    <div style="font:bold 18pt verdana;">
        3D Angle
    </div>
    <hr style="border:solid 1px #000080; background:#000080" />
    <div style="font:10pt verdana; margin-bottom:1.5em">
        <a href="viewsource.php?file=<?=basename(__FILE__)?>">View Chart Source Code</a>
    </div>
    <!-- ****** Here are the chart images ****** -->
    <?php
        for ($i = 0; $i < count($viewers); ++$i) {
            echo $viewers[$i]->renderHTML(), " ";
        }
    ?>
</body>
</html>
© 2022 Advanced Software Engineering Limited. All rights reserved.