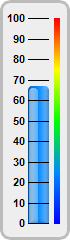
This example demonstrates the basic steps in creating a vertical bar meter.
A vertical bar meter can be created using the following steps:
- Create a LinearMeter object using LinearMeter.LinearMeter, optionally specify the background and border colors and whether to use rounded and/or thick frames..
- Specify the size of the meter scale and the orientation of the scale labels using LinearMeter.setMeter. In this example, the scale labels are positioned at the left of the meter scale. This automatically implies the meter as vertical.
- Set the numeric scale of the meter using BaseMeter.setScale.
- Optionally add a color scale to the meter using BaseMeter.addColorScale. Whereas the meter scale displays the values with text labels, a color scale represents the values with different colors.
- Add a bar to the meter using LinearMeter.addBar. In this example, the bar is added with a glass shading effect specified using glassEffect.
[File: phpdemo/vbarmeter.php]
<?php
require_once("../lib/phpchartdir.php");

# The value to display on the meter
$value = 66.77;

# Create an LinearMeter object of size 70 x 240 pixels with a very light grey (0xeeeeee) background,
# and a rounded 3-pixel thick light grey (0xbbbbbb) border
$m = new LinearMeter(70, 240, 0xeeeeee, 0xbbbbbb);
$m->setRoundedFrame(Transparent);
$m->setThickFrame(3);

# Set the scale region top-left corner at (28, 18), with size of 20 x 205 pixels. The scale labels
# are located on the left (default - implies vertical meter).
$m->setMeter(28, 18, 20, 205);

# Set meter scale from 0 - 100, with a tick every 10 units
$m->setScale(0, 100, 10);

# Add a 5-pixel thick smooth color scale to the meter at x = 54 (right of meter scale)
$smoothColorScale = array(0, 0x0000ff, 25, 0x0088ff, 50, 0x00ff00, 75, 0xffff00, 100, 0xff0000);
$m->addColorScale($smoothColorScale, 54, 5);

# Add a light blue (0x0088ff) bar from 0 to the data value with glass effect and 4 pixel rounded
# corners
$m->addBar(0, $value, 0x0088ff, glassEffect(NormalGlare, Left), 4);

# Output the chart
$viewer = new WebChartViewer("chart1");
$viewer->setChart($m, SVG);
?>

<!DOCTYPE html>
<html>
<head>
    <title>Vertical Bar Meter</title>
    <!-- Include ChartDirector Javascript Library to support chart interactions -->
    <script type="text/javascript" src="cdjcv.js"></script>
</head>
<body style="margin:5px 0px 0px 5px">
    <div style="font:bold 18pt verdana;">
        Vertical Bar Meter
    </div>
    <hr style="border:solid 1px #000080; background:#000080" />
    <div style="font:10pt verdana; margin-bottom:1.5em">
        <a href="viewsource.php?file=<?=basename(__FILE__)?>">View Chart Source Code</a>
    </div>
    <!-- ****** Here is the chart image ****** -->
    <?php echo $viewer->renderHTML(); ?>
</body>
</html>
© 2022 Advanced Software Engineering Limited. All rights reserved.