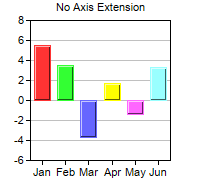
This example demonstrates how to control auto-scaling.
By default, ChartDirector auto-scales all axes. The
Axis.setAutoScale method controls the top extension, bottom extension and the zero affinity parameters that ChartDirector uses during auto-scaling. The first two parameters determine the amount of top and bottom margins to reserve during auto-scaling, while the last parameter determines when the axis should start from the origin (0).
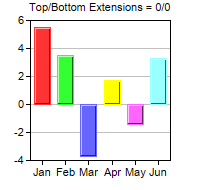
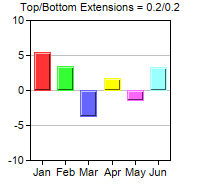
The first 3 charts demonstrate the effects of different top/bottom extensions.
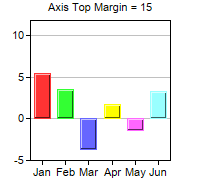
The 4th chart demonstrates that one could exclude a segment on the ends of an axis from scaling using
Axis.setMargin.
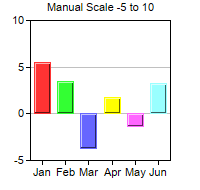
The 5th chart demonstrates manual scaling instead of auto-scaling. In manual scaling, the axis scale is explicitly provided by using
Axis.setLinearScale,
Axis.setLinearScale2,
Axis.setLogScale,
Axis.setLogScale2,
Axis.setDateScale or
Axis.setDateScale2.
pythondemo\axisscale.py
#!/usr/bin/python

# The ChartDirector for Python module is assumed to be in "../lib"
import sys, os
sys.path.insert(0, os.path.join(os.path.abspath(sys.path[0]), "..", "lib"))

from pychartdir import *

def createChart(chartIndex) :

    # The data for the chart
    data = [5.5, 3.5, -3.7, 1.7, -1.4, 3.3]
    labels = ["Jan", "Feb", "Mar", "Apr", "May", "Jun"]

    # Create a XYChart object of size 200 x 190 pixels
    c = XYChart(200, 190)

    # Set the plot area at (30, 20) and of size 140 x 140 pixels
    c.setPlotArea(30, 20, 140, 140)

    # Configure the axis as according to the input parameter
    if chartIndex == 0 :
        c.addTitle("No Axis Extension", "Arial", 8)
    elif chartIndex == 1 :
        c.addTitle("Top/Bottom Extensions = 0/0", "Arial", 8)
        # Reserve 20% margin at top of plot area when auto-scaling
        c.yAxis().setAutoScale(0, 0)
    elif chartIndex == 2 :
        c.addTitle("Top/Bottom Extensions = 0.2/0.2", "Arial", 8)
        # Reserve 20% margin at top and bottom of plot area when auto-scaling
        c.yAxis().setAutoScale(0.2, 0.2)
    elif chartIndex == 3 :
        c.addTitle("Axis Top Margin = 15", "Arial", 8)
        # Reserve 15 pixels at top of plot area
        c.yAxis().setMargin(15)
    else :
        c.addTitle("Manual Scale -5 to 10", "Arial", 8)
        # Set the y axis to scale from -5 to 10, with ticks every 5 units
        c.yAxis().setLinearScale(-5, 10, 5)

    # Set the labels on the x axis
    c.xAxis().setLabels(labels)

    # Add a color bar layer using the given data. Use a 1 pixel 3D border for the bars.
    c.addBarLayer3(data).setBorderColor(-1, 1)

    # Output the chart
    c.makeChart("axisscale%s.png" % chartIndex)


createChart(0)
createChart(1)
createChart(2)
createChart(3)
createChart(4)
© 2021 Advanced Software Engineering Limited. All rights reserved.