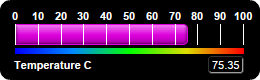
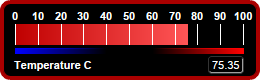
This example demonstrates horizontal bar meters in a black coloring scheme, and with bars in various shading styles.
ChartDirector 7.0 (Python Edition)
Black Horizontal Bar Meters
Source Code Listing
#!/usr/bin/python
# The ChartDirector for Python module is assumed to be in "../lib"
import sys, os
sys.path.insert(0, os.path.join(os.path.abspath(sys.path[0]), "..", "lib"))
from pychartdir import *
def createChart(chartIndex) :
# The value to display on the meter
value = 75.35
# Create a LinearMeter object of size 260 x 80 pixels with black background and rounded corners
m = LinearMeter(260, 80, 0x000000)
m.setRoundedFrame(Transparent)
# Set the default text and line colors to white (0xffffff)
m.setColor(TextColor, 0xffffff)
m.setColor(LineColor, 0xffffff)
# Set the scale region top-left corner at (15, 24), with size of 228 x 20 pixels. The scale
# labels are located on the top (implies horizontal meter)
m.setMeter(15, 24, 228, 20, Top)
# Set meter scale from 0 - 100, with a tick every 10 units
m.setScale(0, 100, 10)
# Demostrate different types of color scales
smoothColorScale = [0, 0x0000ff, 25, 0x0088ff, 50, 0x00ff00, 75, 0xdddd00, 100, 0xff0000]
stepColorScale = [0, 0x00dd00, 50, 0xffff00, 80, 0xff3333, 100]
highLowColorScale = [0, 0x0000ff, 40, Transparent, 60, Transparent, 100, 0xff0000]
highColorScale = [70, Transparent, 100, 0xff0000]
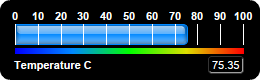
if chartIndex == 0 :
# Add a blue (0x0088ff) bar from 0 to value with glass effect and 4 pixel rounded corners
m.addBar(0, value, 0x0088ff, glassEffect(NormalGlare, Top), 4)
# Add a 5-pixel thick smooth color scale at y = 48 (below the meter scale)
m.addColorScale(smoothColorScale, 48, 5)
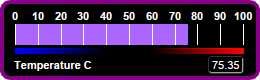
elif chartIndex == 1 :
# Add a purple (0xaa66ff) bar from 0 to value
m.addBar(0, value, 0xaa66ff)
# Add a 4 pixel thick purple (0x880088) frame
m.setThickFrame(4, 0x880088)
# Add a 5-pixel thick high/low color scale at y = 48 (below the meter scale)
m.addColorScale(highLowColorScale, 48, 5)
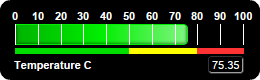
elif chartIndex == 2 :
# Add a green (0x00ee00) bar from 0 to value with right side soft lighting effect and 4
# pixel rounded corners
m.addBar(0, value, 0x00ee00, softLighting(Right), 4)
# Add a 5-pixel thick step color scale at y = 48 (below the meter scale)
m.addColorScale(stepColorScale, 48, 5)
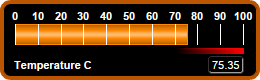
elif chartIndex == 3 :
# Add an orange (0xff8800) bar from 0 to value with cylinder lighting effect
m.addBar(0, value, 0xff8800, cylinderEffect())
# Add a 4 pixel thick brown (0xbb5500) frame
m.setThickFrame(4, 0xbb5500)
# Add a 5-pixel thick high only color scale at y = 48 (below the meter scale)
m.addColorScale(highColorScale, 48, 5)
elif chartIndex == 4 :
# Add a magneta (0xdd00dd) bar from 0 to value with top side soft lighting effect and 4
# pixel rounded corners
m.addBar(0, value, 0xdd00dd, softLighting(Top), 4)
# Add a 5-pixel thick smooth color scale at y = 48 (below the meter scale)
m.addColorScale(smoothColorScale, 48, 5)
else :
# Add a red (0xff0000) bar from 0 to value with bar lighting effect
m.addBar(0, value, 0xff0000, barLighting())
# Add a 4 pixel thick red (0xaa0000) frame
m.setThickFrame(4, 0xaa0000)
# Add a 5-pixel thick high/low color scale at y = 48 (below the meter scale)
m.addColorScale(highLowColorScale, 48, 5)
# Add a label left aligned to (12, 65) using 8pt Arial Bold font
m.addText(12, 65, "Temperature C", "Arial Bold", 8, TextColor, Left)
# Add a text box right aligned to (243, 65). Display the value using white (0xffffff) 8pt Arial
# Bold font on a black (0x000000) background with depressed dark grey (0x333333) rounded border.
t = m.addText(243, 65, m.formatValue(value, "2"), "Arial", 8, 0xffffff, Right)
t.setBackground(0x000000, 0x333333, -1)
t.setRoundedCorners(3)
# Output the chart
m.makeChart("blackhbarmeter%s.png" % chartIndex)
createChart(0)
createChart(1)
createChart(2)
createChart(3)
createChart(4)
createChart(5)