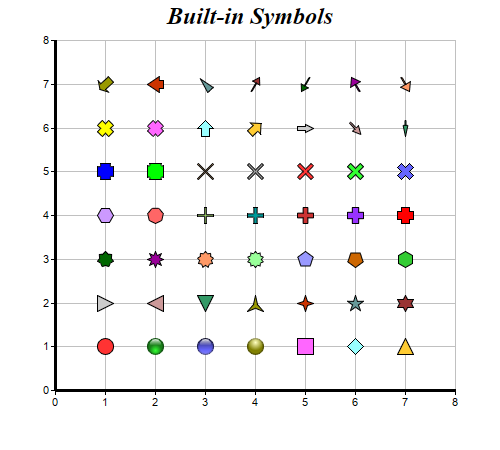
This example demonstrates the built-in symbols supported by ChartDirector.
ChartDirector 7.0 (Python Edition)
Built-In Symbols
Source Code Listing
#!/usr/bin/python

# The ChartDirector for Python module is assumed to be in "../lib"
import sys, os
sys.path.insert(0, os.path.join(os.path.abspath(sys.path[0]), "..", "lib"))

from pychartdir import *

# Some ChartDirector built-in symbols
symbols = [CircleShape, GlassSphereShape, GlassSphere2Shape, SolidSphereShape, SquareShape,
    DiamondShape, TriangleShape, RightTriangleShape, LeftTriangleShape, InvertedTriangleShape,
    StarShape(3), StarShape(4), StarShape(5), StarShape(6), StarShape(7), StarShape(8), StarShape(9
    ), StarShape(10), PolygonShape(5), Polygon2Shape(5), PolygonShape(6), Polygon2Shape(6),
    Polygon2Shape(7), CrossShape(0.1), CrossShape(0.2), CrossShape(0.3), CrossShape(0.4),
    CrossShape(0.5), CrossShape(0.6), CrossShape(0.7), Cross2Shape(0.1), Cross2Shape(0.2),
    Cross2Shape(0.3), Cross2Shape(0.4), Cross2Shape(0.5), Cross2Shape(0.6), Cross2Shape(0.7),
    ArrowShape(), ArrowShape(45), ArrowShape(90, 0.5), ArrowShape(135, 0.5, 0.2), ArrowShape(180,
    0.3, 0.2, 0.3), ArrowShape(225, 1, 0.5, 0.7), ArrowShape(270, 1, 0.5, 0.25), ArrowShape(315,
    0.5, 0.5, 0), ArrowShape(30, 0.5, 0.1, 0.6), ArrowShape(210, 0.5, 0.1, 0.6), ArrowShape(330,
    0.7, 0.1), ArrowShape(150, 0.7, 0.1)]

# Create a XYChart object of size 500 x 450 pixels
c = XYChart(500, 450)

# Set the plotarea at (55, 40) and of size 400 x 350 pixels, with a light grey border (0xc0c0c0).
# Turn on both horizontal and vertical grid lines with light grey color (0xc0c0c0)
c.setPlotArea(55, 40, 400, 350, -1, -1, 0xc0c0c0, 0xc0c0c0, -1)

# Add a title to the chart using 18pt Times Bold Itatic font.
c.addTitle("Built-in Symbols", "Times New Roman Bold Italic", 18)

# Set the axes line width to 3 pixels
c.xAxis().setWidth(3)
c.yAxis().setWidth(3)

# Ensure the ticks are at least 1 unit part (integer ticks)
c.xAxis().setMinTickInc(1)
c.yAxis().setMinTickInc(1)

# Add each symbol as a separate scatter layer.
for i in range(0, len(symbols)) :
    c.addScatterLayer([i % 7 + 1.0], [int(i / 7) + 1.0], "", symbols[i], 17)

# Output the chart
c.makeChart("builtinsymbols.png")