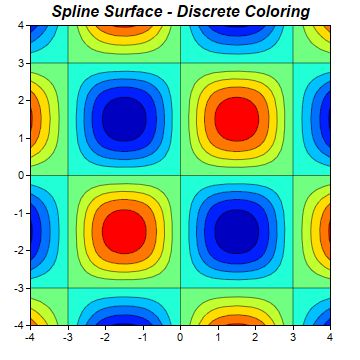
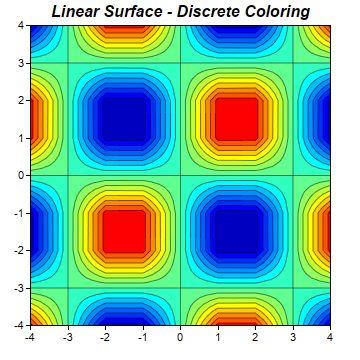
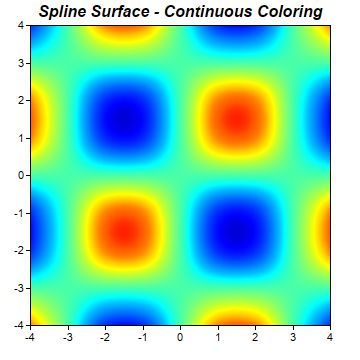
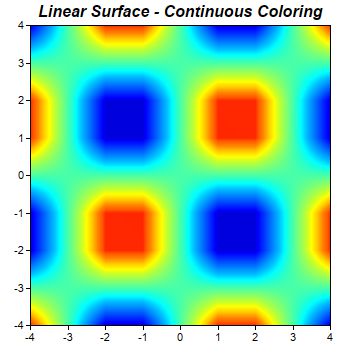
This example demonstrates spline and linear surface interpolation, and discrete and continuous coloring for the
ContourLayer.
The input to the contour layer are the z values at certain (x, y) points. To draw the contour and to color the layer, it is necessarily to know the z values at all pixels in the xy plane. ChartDirector uses surface interpolation to compute the z values at all pixels from the given data points. Two types of interpolation - spline and linear - are supported. They can be configured using
ContourLayer.setSmoothInterpolation.
The coloring of the contour layer can be discrete or continuous, configurable using
ColorAxis.setColorGradient or
ColorAxis.setColorScale.
pythondemo\contourinterpolate.py
#!/usr/bin/python

# The ChartDirector for Python module is assumed to be in "../lib"
import sys, os
sys.path.insert(0, os.path.join(os.path.abspath(sys.path[0]), "..", "lib"))

from pychartdir import *
import math

def createChart(chartIndex) :

    # The x and y coordinates of the grid
    dataX = [-4, -3, -2, -1, 0, 1, 2, 3, 4]
    dataY = [-4, -3, -2, -1, 0, 1, 2, 3, 4]

    # The values at the grid points. In this example, we will compute the values using the formula z
    # = Sin(x * pi / 3) * Sin(y * pi / 3).
    dataZ = [0] * (len(dataX) * len(dataY))
    for yIndex in range(0, len(dataY)) :
        y = dataY[yIndex]
        for xIndex in range(0, len(dataX)) :
            x = dataX[xIndex]
            dataZ[yIndex * len(dataX) + xIndex] = math.sin(x * 3.1416 / 3) * math.sin(y * 3.1416 / 3
                )

    # Create a XYChart object of size 360 x 360 pixels
    c = XYChart(360, 360)

    # Set the plotarea at (30, 25) and of size 300 x 300 pixels. Use semi-transparent black
    # (c0000000) for both horizontal and vertical grid lines
    c.setPlotArea(30, 25, 300, 300, -1, -1, -1, 0xc0000000, -1)

    # Add a contour layer using the given data
    layer = c.addContourLayer(dataX, dataY, dataZ)

    # Set the x-axis and y-axis scale
    c.xAxis().setLinearScale(-4, 4, 1)
    c.yAxis().setLinearScale(-4, 4, 1)

    if chartIndex == 0 :
        # Discrete coloring, spline surface interpolation
        c.addTitle("Spline Surface - Discrete Coloring", "Arial Bold Italic", 12)
    elif chartIndex == 1 :
        # Discrete coloring, linear surface interpolation
        c.addTitle("Linear Surface - Discrete Coloring", "Arial Bold Italic", 12)
        layer.setSmoothInterpolation(0)
    elif chartIndex == 2 :
        # Smooth coloring, spline surface interpolation
        c.addTitle("Spline Surface - Continuous Coloring", "Arial Bold Italic", 12)
        layer.setContourColor(Transparent)
        layer.colorAxis().setColorGradient(1)
    else :
        # Discrete coloring, linear surface interpolation
        c.addTitle("Linear Surface - Continuous Coloring", "Arial Bold Italic", 12)
        layer.setSmoothInterpolation(0)
        layer.setContourColor(Transparent)
        layer.colorAxis().setColorGradient(1)

    # Output the chart
    c.makeChart("contourinterpolate%s.jpg" % chartIndex)


createChart(0)
createChart(1)
createChart(2)
createChart(3)
© 2021 Advanced Software Engineering Limited. All rights reserved.