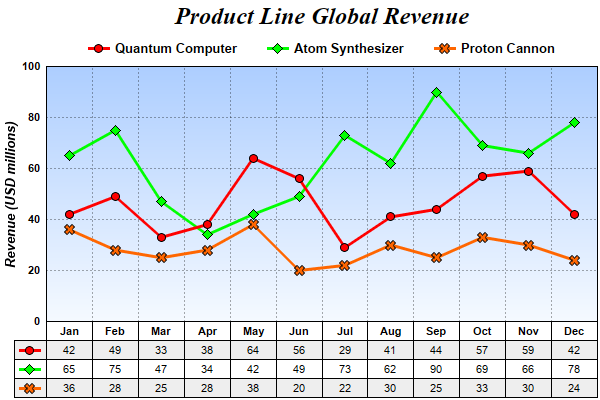
This example demonstrates putting a data table under the x-axis.
In ChartDirector, the labels in a label based x-axis (that is, axis configured with
Axis.setLabels or
Axis.setLabels2) can be converted to a table using
Axis.makeLabelTable.
Note: Axis.makeLabelTable is only supported on a label based axis with no label stepping. You should not use this method with other axis configuration.
The
Axis.makeLabelTable returns a
CDMLTable object representing the table. It can be used to add more content to the table and to configure the appearance of the table.
In this example, 3 rows with alternating background colors are added to the table using
CDMLTable.appendRow. The cells in the rows are filled with data values using
CDMLTable.setText. A column is added to the left of the table using
CDMLTable.insertCol, and filled with the legend icons obtained using
Layer.getLegendIcon.
pythondemo\datatable.py
#!/usr/bin/python

# The ChartDirector for Python module is assumed to be in "../lib"
import sys, os
sys.path.insert(0, os.path.join(os.path.abspath(sys.path[0]), "..", "lib"))

from pychartdir import *

# The data for the line chart
data0 = [42, 49, 33, 38, 64, 56, 29, 41, 44, 57, 59, 42]
data1 = [65, 75, 47, 34, 42, 49, 73, 62, 90, 69, 66, 78]
data2 = [36, 28, 25, 28, 38, 20, 22, 30, 25, 33, 30, 24]
labels = ["Jan", "Feb", "Mar", "Apr", "May", "Jun", "Jul", "Aug", "Sep", "Oct", "Nov", "Dec"]

# Create a XYChart object of size 600 x 400 pixels
c = XYChart(600, 400)

# Add a title to the chart using 18pt Times Bold Italic font
title = c.addTitle("Product Line Global Revenue", "Times New Roman Bold Italic", 18)

# Tentatively set the plotarea at (50, 55) and of (chart_width - 100) x (chart_height - 120) pixels
# in size. Use a vertical gradient color from sky blue (aaccff) t0 light blue (f9f9ff) as
# background. Set both horizontal and vertical grid lines to dotted semi-transprent black
# (aa000000).
plotArea = c.setPlotArea(50, 55, c.getWidth() - 100, c.getHeight() - 120, c.linearGradientColor(0,
    55, 0, 55 + c.getHeight() - 120, 0xaaccff, 0xf9fcff), -1, -1, c.dashLineColor(0xaa000000,
    DotLine), -1)

# Add a legend box and anchored the top center at the horizontal center of the chart, just under the
# title. Use 10pt Arial Bold as font, with transparent background and border.
legendBox = c.addLegend(c.getWidth() / 2, title.getHeight(), 0, "Arial Bold", 10)
legendBox.setAlignment(TopCenter)
legendBox.setBackground(Transparent, Transparent)

# Set y-axis title using 10 points Arial Bold Italic font, label style to 8 points Arial Bold, and
# axis color to transparent
c.yAxis().setTitle("Revenue (USD millions)", "Arial Bold Italic", 10)
c.yAxis().setLabelStyle("Arial Bold", 8)
c.yAxis().setColors(Transparent)

# Set y-axis tick density to 30 pixels. ChartDirector auto-scaling will use this as the guideline
# when putting ticks on the y-axis.
c.yAxis().setTickDensity(30)

# Add a line layer to the chart
layer = c.addLineLayer2()

# Set the line width to 3 pixels
layer.setLineWidth(3)

# Add the three data sets to the line layer, using circles, diamands and X shapes as symbols
layer.addDataSet(data0, 0xff0000, "Quantum Computer").setDataSymbol(CircleSymbol, 9)
layer.addDataSet(data1, 0x00ff00, "Atom Synthesizer").setDataSymbol(DiamondSymbol, 11)
layer.addDataSet(data2, 0xff6600, "Proton Cannon").setDataSymbol(Cross2Shape(), 11)

# Set the x axis labels
c.xAxis().setLabels(labels)

# Convert the labels on the x-axis to a CDMLTable
table = c.xAxis().makeLabelTable()

# Set the default top/bottom margins of the cells to 3 pixels
table.getStyle().setMargin2(0, 0, 3, 3)

# Use Arial Bold as the font for the first row
table.getRowStyle(0).setFontStyle("Arial Bold")

#
# We can add more information to the table. In this sample code, we add the data series and the
# legend icons to the table.
#

# Add 3 more rows to the table. Set the background of the 1st and 3rd rows to light grey (eeeeee).
table.appendRow().setBackground(0xeeeeee, LineColor)
table.appendRow()
table.appendRow().setBackground(0xeeeeee, LineColor)

# Put the values of the 3 data series to the cells in the 3 rows
for i in range(0, len(data0)) :
    table.setText(i, 1, str(data0[i]))
    table.setText(i, 2, str(data1[i]))
    table.setText(i, 3, str(data2[i]))

# Insert a column on the left for the legend icons. Use 5 pixels left/right margins and 3 pixels
# top/bottom margins for the cells in this column.
table.insertCol(0).setMargin2(5, 5, 3, 3)

# The top cell is set to transparent, so it is invisible
table.getCell(0, 0).setBackground(Transparent, Transparent)

# The other 3 cells are set to the legend icons of the 3 data series
table.setText(0, 1, layer.getLegendIcon(0))
table.setText(0, 2, layer.getLegendIcon(1))
table.setText(0, 3, layer.getLegendIcon(2))

# Layout legend box first, so we can get its size
c.layoutLegend()

# Adjust the plot area size, such that the bounding box (inclusive of axes) is 2 pixels from the
# left, right and bottom edge, and is just under the legend box.
c.packPlotArea(2, legendBox.getTopY() + legendBox.getHeight(), c.getWidth() - 3, c.getHeight() - 3)

# After determining the exact plot area position, we may adjust the legend box and the title
# positions so that they are centered relative to the plot area (instead of the chart)
legendBox.setPos(plotArea.getLeftX() + (plotArea.getWidth() - legendBox.getWidth()) / 2,
    legendBox.getTopY())
title.setPos(plotArea.getLeftX() + (plotArea.getWidth() - title.getWidth()) / 2, title.getTopY())

# Output the chart
c.makeChart("datatable.png")
© 2021 Advanced Software Engineering Limited. All rights reserved.