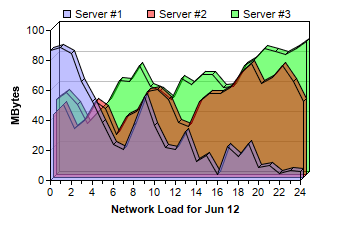
This example demonstrates using multiple area layers with semi-transparent colors to create a depth area chart.
ChartDirector allows an XYChart to containing multiple layers of the same or different types. In this example, all layers are 3D area layers. The areas are filled using semi-transparent colors to avoid the area on the front hiding the areas at the back.
pythondemo\deptharea.py
#!/usr/bin/python

# The ChartDirector for Python module is assumed to be in "../lib"
import sys, os
sys.path.insert(0, os.path.join(os.path.abspath(sys.path[0]), "..", "lib"))

from pychartdir import *

# The data for the area chart
data0 = [42, 49, 33, 38, 51, 46, 29, 41, 44, 57, 59, 52, 37, 34, 51, 56, 56, 60, 70, 76, 63, 67, 75,
    64, 51]
data1 = [50, 55, 47, 34, 42, 49, 63, 62, 73, 59, 56, 50, 64, 60, 67, 67, 58, 59, 73, 77, 84, 82, 80,
    84, 89]
data2 = [87, 89, 85, 66, 53, 39, 24, 21, 37, 56, 37, 22, 21, 33, 13, 17, 4, 23, 16, 25, 9, 10, 5, 7,
    6]
labels = ["0", "1", "2", "3", "4", "5", "6", "7", "8", "9", "10", "11", "12", "13", "14", "15",
    "16", "17", "18", "19", "20", "21", "22", "23", "24"]

# Create a XYChart object of size 350 x 230 pixels
c = XYChart(350, 230)

# Set the plotarea at (50, 30) and of size 250 x 150 pixels.
c.setPlotArea(50, 30, 250, 150)

# Add a legend box at (55, 0) (top of the chart) using 8pt Arial Font. Set background and border to
# Transparent.
c.addLegend(55, 0, 0, "", 8).setBackground(Transparent)

# Add a title to the x axis
c.xAxis().setTitle("Network Load for Jun 12")

# Add a title to the y axis
c.yAxis().setTitle("MBytes")

# Set the labels on the x axis.
c.xAxis().setLabels(labels)

# Display 1 out of 2 labels on the x-axis. Show minor ticks for remaining labels.
c.xAxis().setLabelStep(2, 1)

# Add three area layers, each representing one data set. The areas are drawn in semi-transparent
# colors.
c.addAreaLayer(data2, 0x808080ff, "Server #1", 3)
c.addAreaLayer(data0, 0x80ff0000, "Server #2", 3)
c.addAreaLayer(data1, 0x8000ff00, "Server #3", 3)

# Output the chart
c.makeChart("deptharea.png")
© 2021 Advanced Software Engineering Limited. All rights reserved.