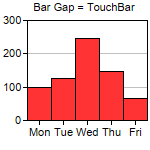
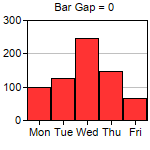
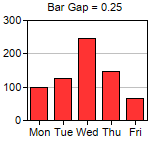
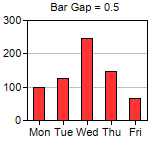
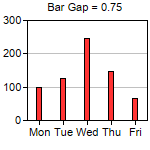
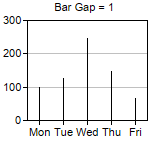
This example demonstrates the effects of different bar gaps configured using BarLayer.setBarGap.
ChartDirector 7.0 (Python Edition)
Bar Gap
Source Code Listing
#!/usr/bin/python

# The ChartDirector for Python module is assumed to be in "../lib"
import sys, os
sys.path.insert(0, os.path.join(os.path.abspath(sys.path[0]), "..", "lib"))

from pychartdir import *

def createChart(chartIndex) :

    bargap = chartIndex * 0.25 - 0.25

    # The data for the bar chart
    data = [100, 125, 245, 147, 67]

    # The labels for the bar chart
    labels = ["Mon", "Tue", "Wed", "Thu", "Fri"]

    # Create a XYChart object of size 150 x 150 pixels
    c = XYChart(150, 150)

    # Set the plotarea at (27, 20) and of size 120 x 100 pixels
    c.setPlotArea(27, 20, 120, 100)

    # Set the labels on the x axis
    c.xAxis().setLabels(labels)

    if bargap >= 0 :
        # Add a title to display to bar gap using 8pt Arial font
        c.addTitle("      Bar Gap = %s" % (bargap), "Arial", 8)
    else :
        # Use negative value to mean TouchBar
        c.addTitle("      Bar Gap = TouchBar", "Arial", 8)
        bargap = TouchBar

    # Add a bar chart layer using the given data and set the bar gap
    c.addBarLayer(data).setBarGap(bargap)

    # Output the chart
    c.makeChart("gapbar%s.png" % chartIndex)


createChart(0)
createChart(1)
createChart(2)
createChart(3)
createChart(4)
createChart(5)