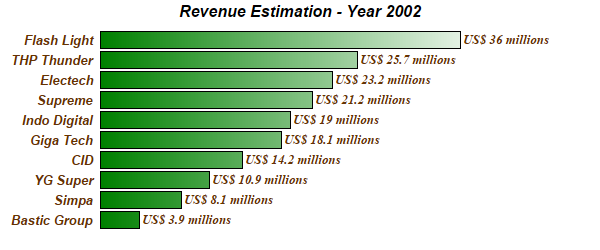
This example demonstrates a horizontal bar chart with no axes, grid lines or and plot area border. It also demonstrates using gradient colors for the bars, and a number of other ChartDirector features.
The key features demonstrated in this example are:
pythondemo\hbar.py
#!/usr/bin/python

# The ChartDirector for Python module is assumed to be in "../lib"
import sys, os
sys.path.insert(0, os.path.join(os.path.abspath(sys.path[0]), "..", "lib"))

from pychartdir import *

# The data for the bar chart
data = [3.9, 8.1, 10.9, 14.2, 18.1, 19.0, 21.2, 23.2, 25.7, 36]

# The labels for the bar chart
labels = ["Bastic Group", "Simpa", "YG Super", "CID", "Giga Tech", "Indo Digital", "Supreme",
    "Electech", "THP Thunder", "Flash Light"]

# Create a XYChart object of size 600 x 250 pixels
c = XYChart(600, 250)

# Add a title to the chart using Arial Bold Italic font
c.addTitle("Revenue Estimation - Year 2002", "Arial Bold Italic")

# Set the plotarea at (100, 30) and of size 400 x 200 pixels. Set the plotarea border, background
# and grid lines to Transparent
c.setPlotArea(100, 30, 400, 200, Transparent, Transparent, Transparent, Transparent, Transparent)

# Add a bar chart layer using the given data. Use a gradient color for the bars, where the gradient
# is from dark green (0x008000) to white (0xffffff)
layer = c.addBarLayer(data, c.gradientColor(100, 0, 500, 0, 0x008000, 0xffffff))

# Swap the axis so that the bars are drawn horizontally
c.swapXY(1)

# Set the bar gap to 10%
layer.setBarGap(0.1)

# Use the format "US$ xxx millions" as the bar label
layer.setAggregateLabelFormat("US$ {value} millions")

# Set the bar label font to 10pt Times Bold Italic/dark red (0x663300)
layer.setAggregateLabelStyle("Times New Roman Bold Italic", 10, 0x663300)

# Set the labels on the x axis
textbox = c.xAxis().setLabels(labels)

# Set the x axis label font to 10pt Arial Bold Italic
textbox.setFontStyle("Arial Bold Italic")
textbox.setFontSize(10)

# Set the x axis to Transparent, with labels in dark red (0x663300)
c.xAxis().setColors(Transparent, 0x663300)

# Set the y axis and labels to Transparent
c.yAxis().setColors(Transparent, Transparent)

# Output the chart
c.makeChart("hbar.png")
© 2021 Advanced Software Engineering Limited. All rights reserved.