This example demonstrates using a pattern for filling the area in an area chart, together with a number of chart formatting features.
pythondemo\patternarea.py
#!/usr/bin/python
# The ChartDirector for Python module is assumed to be in "../lib"
import sys, os
sys.path.insert(0, os.path.join(os.path.abspath(sys.path[0]), "..", "lib"))
from pychartdir import *
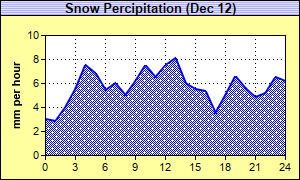
# The data for the area chart
data = [3.0, 2.8, 4.0, 5.5, 7.5, 6.8, 5.4, 6.0, 5.0, 6.2, 7.5, 6.5, 7.5, 8.1, 6.0, 5.5, 5.3, 3.5,
5.0, 6.6, 5.6, 4.8, 5.2, 6.5, 6.2]
# The labels for the area chart
labels = ["0", "1", "2", "3", "4", "5", "6", "7", "8", "9", "10", "11", "12", "13", "14", "15",
"16", "17", "18", "19", "20", "21", "22", "23", "24"]
# Create a XYChart object of size 300 x 180 pixels. Set the background to pale yellow (0xffffa0)
# with a black border (0x0)
c = XYChart(300, 180, 0xffffa0, 0x000000)
# Set the plotarea at (45, 35) and of size 240 x 120 pixels. Set the background to white (0xffffff).
# Set both horizontal and vertical grid lines to black (&H0&) dotted lines (pattern code 0x0103)
c.setPlotArea(45, 35, 240, 120, 0xffffff, -1, -1, c.dashLineColor(0x000000, 0x000103),
c.dashLineColor(0x000000, 0x000103))
# Add a title to the chart using 10pt Arial Bold font. Use a 1 x 2 bitmap pattern as the background.
# Set the border to black (0x0).
c.addTitle("Snow Percipitation (Dec 12)", "Arial Bold", 10).setBackground(c.patternColor([0xb0b0f0,
0xe0e0ff], 2), 0x000000)
# Add a title to the y axis
c.yAxis().setTitle("mm per hour")
# Set the labels on the x axis.
c.xAxis().setLabels(labels)
# Display 1 out of 3 labels on the x-axis.
c.xAxis().setLabelStep(3)
# Add an area layer to the chart
layer = c.addAreaLayer()
# Load a snow pattern from an external file "snow.png".
snowPattern = c.patternColor2("snow.png")
# Add a data set to the area layer using the snow pattern as the fill color. Use deep blue
# (0x0000ff) as the area border line color (&H0000ff&)
layer.addDataSet(data).setDataColor(snowPattern, 0x0000ff)
# Set the line width to 2 pixels to highlight the line
layer.setLineWidth(2)
# Output the chart
c.makeChart("patternarea.png")
© 2021 Advanced Software Engineering Limited. All rights reserved.