pythondemo\polarvector.py
#!/usr/bin/python
# The ChartDirector for Python module is assumed to be in "../lib"
import sys, os
sys.path.insert(0, os.path.join(os.path.abspath(sys.path[0]), "..", "lib"))
from pychartdir import *
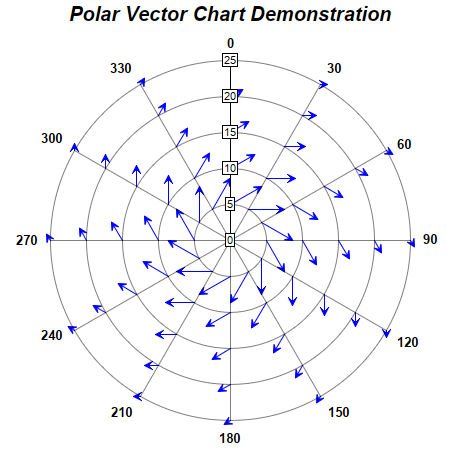
# Coordinates of the starting points of the vectors
radius = [5, 5, 5, 5, 5, 5, 5, 5, 5, 5, 5, 5, 10, 10, 10, 10, 10, 10, 10, 10, 10, 10, 10, 10, 15,
15, 15, 15, 15, 15, 15, 15, 15, 15, 15, 15, 20, 20, 20, 20, 20, 20, 20, 20, 20, 20, 20, 20, 25,
25, 25, 25, 25, 25, 25, 25, 25, 25, 25, 25]
angle = [0, 30, 60, 90, 120, 150, 180, 210, 240, 270, 300, 330, 0, 30, 60, 90, 120, 150, 180, 210,
240, 270, 300, 330, 0, 30, 60, 90, 120, 150, 180, 210, 240, 270, 300, 330, 0, 30, 60, 90, 120,
150, 180, 210, 240, 270, 300, 330, 0, 30, 60, 90, 120, 150, 180, 210, 240, 270, 300, 330]
# Magnitude and direction of the vectors
magnitude = [5, 5, 5, 5, 5, 5, 5, 5, 5, 5, 5, 5, 4, 4, 4, 4, 4, 4, 4, 4, 4, 4, 4, 4, 3, 3, 3, 3, 3,
3, 3, 3, 3, 3, 3, 3, 2, 2, 2, 2, 2, 2, 2, 2, 2, 2, 2, 2, 1, 1, 1, 1, 1, 1, 1, 1, 1, 1, 1, 1]
direction = [60, 90, 120, 150, 180, 210, 240, 270, 300, 330, 0, 30, 60, 90, 120, 150, 180, 210, 240,
270, 300, 330, 0, 30, 60, 90, 120, 150, 180, 210, 240, 270, 300, 330, 0, 30, 60, 90, 120, 150,
180, 210, 240, 270, 300, 330, 0, 30, 60, 90, 120, 150, 180, 210, 240, 270, 300, 330, 0, 30]
# Create a PolarChart object of size 460 x 460 pixels
c = PolarChart(460, 460)
# Add a title to the chart at the top left corner using 15pt Arial Bold Italic font
c.addTitle("Polar Vector Chart Demonstration", "Arial Bold Italic", 15)
# Set center of plot area at (230, 240) with radius 180 pixels
c.setPlotArea(230, 240, 180)
# Set the grid style to circular grid
c.setGridStyle(0)
# Set angular axis as 0 - 360, with a spoke every 30 units
c.angularAxis().setLinearScale(0, 360, 30)
# Add a polar vector layer to the chart with blue (0000ff) vectors
c.addVectorLayer(radius, angle, magnitude, direction, RadialAxisScale, 0x0000ff)
# Output the chart
c.makeChart("polarvector.png")
© 2021 Advanced Software Engineering Limited. All rights reserved.