This example demonstrates the basic steps in creating pie charts.
pythondemo\simplepie.py
#!/usr/bin/python
# The ChartDirector for Python module is assumed to be in "../lib"
import sys, os
sys.path.insert(0, os.path.join(os.path.abspath(sys.path[0]), "..", "lib"))
from pychartdir import *
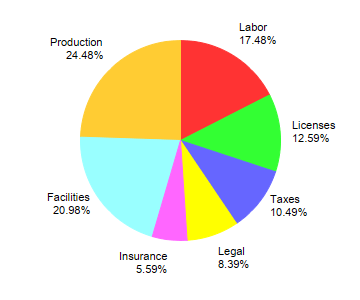
# The data for the pie chart
data = [25, 18, 15, 12, 8, 30, 35]
# The labels for the pie chart
labels = ["Labor", "Licenses", "Taxes", "Legal", "Insurance", "Facilities", "Production"]
# Create a PieChart object of size 360 x 300 pixels
c = PieChart(360, 300)
# Set the center of the pie at (180, 140) and the radius to 100 pixels
c.setPieSize(180, 140, 100)
# Set the pie data and the pie labels
c.setData(data, labels)
# Output the chart
c.makeChart("simplepie.png")
© 2021 Advanced Software Engineering Limited. All rights reserved.