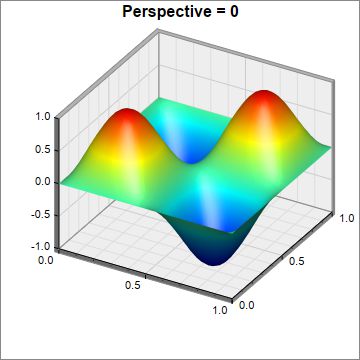
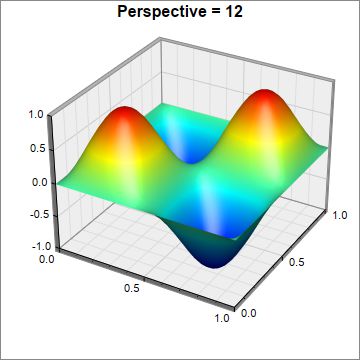
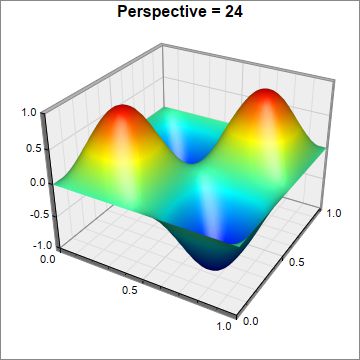
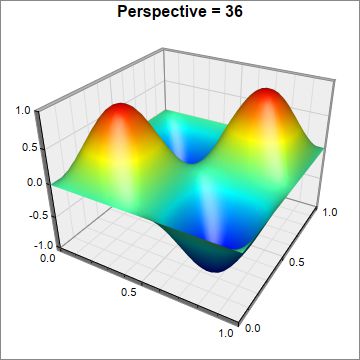
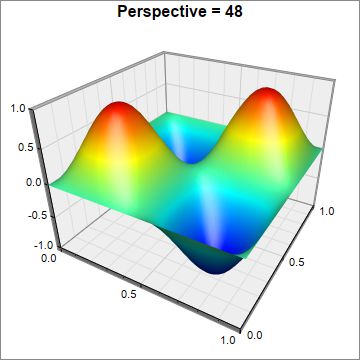
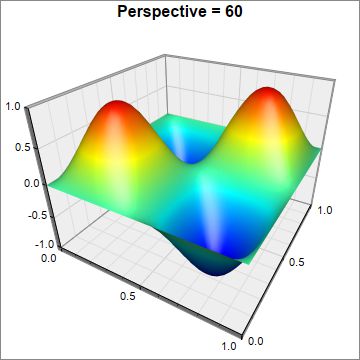
This example demonstrates the effects of various perspective depth, configured using ThreeDChart.setPerspective.
ChartDirector 7.0 (Python Edition)
Surface Perspective
Source Code Listing
#!/usr/bin/python

# The ChartDirector for Python module is assumed to be in "../lib"
import sys, os
sys.path.insert(0, os.path.join(os.path.abspath(sys.path[0]), "..", "lib"))

from pychartdir import *
import math

def createChart(chartIndex) :

    # The x and y coordinates of the grid
    dataX = [0, 0.1, 0.2, 0.3, 0.4, 0.5, 0.6, 0.7, 0.8, 0.9, 1.0]
    dataY = [0, 0.1, 0.2, 0.3, 0.4, 0.5, 0.6, 0.7, 0.8, 0.9, 1.0]

    # The values at the grid points. In this example, we will compute the values using the formula z
    # = sin((x - 0.5) * 2 * pi) * sin((y - 0.5) * 2 * pi)
    dataZ = [0] * (len(dataX) * len(dataY))
    for yIndex in range(0, len(dataY)) :
        y = (dataY[yIndex] - 0.5) * 2 * 3.1416
        for xIndex in range(0, len(dataX)) :
            x = (dataX[xIndex] - 0.5) * 2 * 3.1416
            dataZ[yIndex * len(dataX) + xIndex] = math.sin(x) * math.sin(y)

    # the perspective level
    perspective = chartIndex * 12

    # Create a SurfaceChart object of size 360 x 360 pixels, with white (ffffff) background and grey
    # (888888) border.
    c = SurfaceChart(360, 360, 0xffffff, 0x888888)

    # Set the perspective level
    c.setPerspective(perspective)
    c.addTitle("Perspective = %s" % (perspective))

    # Set the center of the plot region at (195, 165), and set width x depth x height to 200 x 200 x
    # 150 pixels
    c.setPlotRegion(195, 165, 200, 200, 150)

    # Set the plot region wall thichness to 5 pixels
    c.setWallThickness(5)

    # Set the elevation and rotation angles to 30 and 30 degrees
    c.setViewAngle(30, 30)

    # Set the data to use to plot the chart
    c.setData(dataX, dataY, dataZ)

    # Spline interpolate data to a 40 x 40 grid for a smooth surface
    c.setInterpolation(40, 40)

    # Use smooth gradient coloring.
    c.colorAxis().setColorGradient()

    # Output the chart
    c.makeChart("surfaceperspective%s.jpg" % chartIndex)


createChart(0)
createChart(1)
createChart(2)
createChart(3)
createChart(4)
createChart(5)