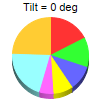

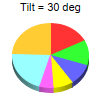
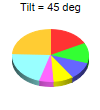
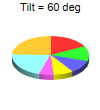
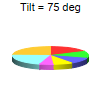
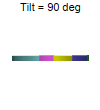
This example demonstrates the effects of different 3D angles.
ChartDirector allows the 3D depth and angles to be configured using
PieChart.set3D and
PieChart.set3D2.
This example also demonstrates how to disable sector labels. This is setting their colors to
Transparent using
PieChart.setLabelStyle.
pythondemo\threedanglepie.py
#!/usr/bin/python

# The ChartDirector for Python module is assumed to be in "../lib"
import sys, os
sys.path.insert(0, os.path.join(os.path.abspath(sys.path[0]), "..", "lib"))

from pychartdir import *

def createChart(chartIndex) :

    # the tilt angle of the pie
    angle = chartIndex * 15

    # The data for the pie chart
    data = [25, 18, 15, 12, 8, 30, 35]

    # Create a PieChart object of size 100 x 110 pixels
    c = PieChart(100, 110)

    # Set the center of the pie at (50, 55) and the radius to 38 pixels
    c.setPieSize(50, 55, 38)

    # Set the depth and tilt angle of the 3D pie (-1 means auto depth)
    c.set3D(-1, angle)

    # Add a title showing the tilt angle
    c.addTitle("Tilt = %s deg" % (angle), "Arial", 8)

    # Set the pie data
    c.setData(data)

    # Disable the sector labels by setting the color to Transparent
    c.setLabelStyle("", 8, Transparent)

    # Output the chart
    c.makeChart("threedanglepie%s.png" % chartIndex)


createChart(0)
createChart(1)
createChart(2)
createChart(3)
createChart(4)
createChart(5)
createChart(6)
© 2021 Advanced Software Engineering Limited. All rights reserved.