This example extends the
Simple Pyramid Chart example by viewing the pyramid in 3D, using custom colors, inserting gaps between pyramid layers, and adding labels to both the center and the right side of the pyramid layers.
pythondemo\threedpyramid.py
#!/usr/bin/python
# The ChartDirector for Python module is assumed to be in "../lib"
import sys, os
sys.path.insert(0, os.path.join(os.path.abspath(sys.path[0]), "..", "lib"))
from pychartdir import *
# The data for the pyramid chart
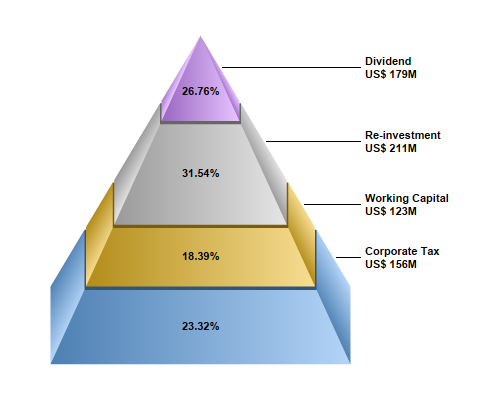
data = [156, 123, 211, 179]
# The labels for the pyramid chart
labels = ["Corporate Tax", "Working Capital", "Re-investment", "Dividend"]
# The colors for the pyramid layers
colors = [0x66aaee, 0xeebb22, 0xcccccc, 0xcc88ff]
# Create a PyramidChart object of size 500 x 400 pixels
c = PyramidChart(500, 400)
# Set the pyramid center at (200, 180), and width x height to 150 x 300 pixels
c.setPyramidSize(200, 180, 150, 300)
# Set the elevation to 15 degrees
c.setViewAngle(15)
# Set the pyramid data and labels
c.setData(data, labels)
# Set the layer colors to the given colors
c.setColors2(DataColor, colors)
# Leave 1% gaps between layers
c.setLayerGap(0.01)
# Add labels at the center of the pyramid layers using Arial Bold font. The labels will show the
# percentage of the layers.
c.setCenterLabel("{percent}%", "Arial Bold")
# Add labels at the right side of the pyramid layers using Arial Bold font. The labels will have two
# lines showing the layer name and value.
c.setRightLabel("{label}\nUS$ {value}M", "Arial Bold")
# Output the chart
c.makeChart("threedpyramid.png")
© 2021 Advanced Software Engineering Limited. All rights reserved.