require("chartdirector")
class Angularpointer2Controller < ApplicationController
def index()
@title = "Angular Meter Pointers (2)"
@ctrl_file = File.expand_path(__FILE__)
@noOfCharts = 1
render :template => "templates/chartview"
end
#
# Render and deliver the chart
#
def getchart()
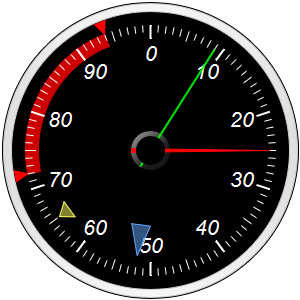
# Create an AngularMeter object of size 300 x 300 pixels with transparent background
m = ChartDirector::AngularMeter.new(300, 300, ChartDirector::Transparent)
# Set the default text and line colors to white (0xffffff)
m.setColor(ChartDirector::TextColor, 0xffffff)
m.setColor(ChartDirector::LineColor, 0xffffff)
# Center at (150, 150), scale radius = 125 pixels, scale angle 0 to 360 degrees
m.setMeter(150, 150, 125, 0, 360)
# Add a black (0x000000) circle with radius 148 pixels as background
m.addRing(0, 148, 0x000000)
# Add a ring between radii 139 and 147 pixels using the silver color with a light grey
# (0xcccccc) edge as border
m.addRing(139, 147, ChartDirector::silverColor(), 0xcccccc)
# Meter scale is 0 - 100, with major/minor/micro ticks every 10/5/1 units
m.setScale(0, 100, 10, 5, 1)
# Set the scale label style to 16pt Arial Italic. Set the major/minor/micro tick lengths to
# 13/10/7 pixels pointing inwards, and their widths to 2/1/1 pixels.
m.setLabelStyle("ariali.ttf", 16)
m.setTickLength(-13, -10, -7)
m.setLineWidth(0, 2, 1, 1)
# Add a default red (0xff0000) pointer
m.addPointer2(25, 0xff0000)
# Add a semi-transparent green (0x3f00ff00) line style pointer
m.addPointer2(9, 0x3f00ff00, -1, ChartDirector::LinePointer2)
# Add a semi-transparent blue (0x7f66aaff) triangular pointer floating between 60% and 85%
# of the scale radius with the pointer width 5 times the default
m.addPointer2(52, 0x7f66aaff, 0x66aaff, ChartDirector::TriangularPointer2, 0.6, 0.85, 5)
# Add a semi-transparent yellow (0x7fffff66) triangular pointer floating between 80% and 90%
# of the scale radius with the pointer width 5 times the default
m.addPointer2(65, 0x7fffff66, 0xffff66, ChartDirector::TriangularPointer2, 0.8, 0.9, 5)
# Add two red (0xff0000) triangular pointer at 72 and 94. The pointers float between 110%
# and 100% of the scale radius with widths 3 times the default
m.addPointer2(72, 0xff0000, -1, ChartDirector::TriangularPointer2, 1.1, 1.0, 3)
m.addPointer2(94, 0xff0000, -1, ChartDirector::TriangularPointer2, 1.1, 1.0, 3)
# Add a red (0xcc0000) zone spanning from 72 to 94, and between the radii 112 and 125
m.addZone(72, 94, 125, 112, 0xcc0000)
# Output the chart
send_data(m.makeChart2(ChartDirector::PNG), :type => "image/png", :disposition => "inline")
end
end |