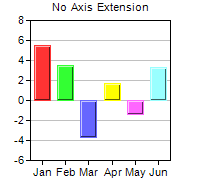
This example demonstrates how to control auto-scaling.
By default, ChartDirector auto-scales all axes. The Axis.setAutoScale method controls the top extension, bottom extension and the zero affinity parameters that ChartDirector uses during auto-scaling. The first two parameters determine the amount of top and bottom margins to reserve during auto-scaling, while the last parameter determines when the axis should start from the origin (0).
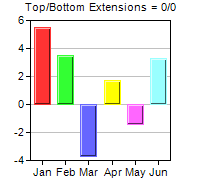
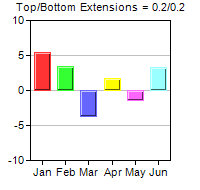
The first 3 charts demonstrate the effects of different top/bottom extensions.
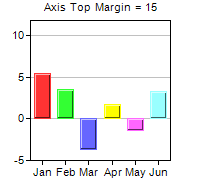
The 4th chart demonstrates that one could exclude a segment on the ends of an axis from scaling using Axis.setMargin.
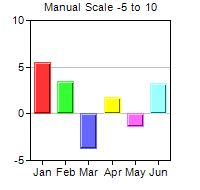
The 5th chart demonstrates manual scaling instead of auto-scaling. In manual scaling, the axis scale is explicitly provided by using Axis.setLinearScale, Axis.setLinearScale2, Axis.setLogScale, Axis.setLogScale2, Axis.setDateScale or Axis.setDateScale2.