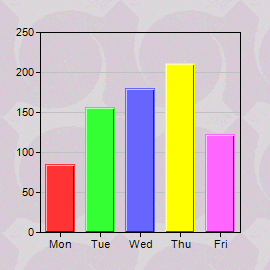

This example demonstrates some of the background effects supported by ChartDirector.
ChartDirector supports using an image file as the wallpaper of the chart image background with
BaseChart.setWallpaper, and as the plot area background with
PlotArea.setBackground2.
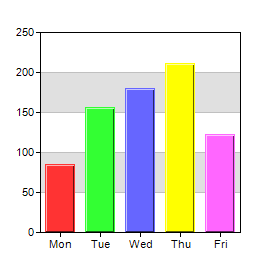
In addition to wallpapers, ChartDirector supports alternating plot area background colors using
PlotArea.setBackground and
PlotArea.setAltBgColor.
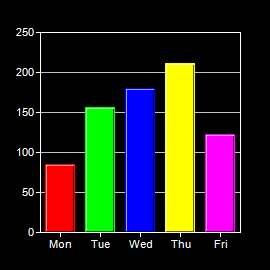
You can switch the default colors to using a dark background with white lines and text in one step by changing the color palette to a
whiteOnBlackPalette using
BaseChart.setColors.
[Ruby On Rails Version - Controller] app/controllers/background_controller.rb
require("chartdirector")

class BackgroundController < ApplicationController

    def index()
        @title = "Background and Wallpaper"
        @ctrl_file = File.expand_path(__FILE__)
        @noOfCharts = 4
        render :template => "templates/chartview"
    end

    #
    # Render and deliver the chart
    #
    def getchart()
        # This script can draw different charts depending on the chartIndex
        chartIndex = (params["img"]).to_i

        # The data for the chart
        data = [85, 156, 179.5, 211, 123]
        labels = ["Mon", "Tue", "Wed", "Thu", "Fri"]

        # Create a XYChart object of size 270 x 270 pixels
        c = ChartDirector::XYChart.new(270, 270)

        # Set the plot area at (40, 32) and of size 200 x 200 pixels
        plotarea = c.setPlotArea(40, 32, 200, 200)

        # Set the background style based on the input parameter
        if chartIndex == 0
            # Has wallpaper image
            c.setWallpaper(File.dirname(__FILE__) + "/tile.gif")
        elsif chartIndex == 1
            # Use a background image as the plot area background
            plotarea.setBackground2(File.dirname(__FILE__) + "/bg.png")
        elsif chartIndex == 2
            # Use white (0xffffff) and grey (0xe0e0e0) as two alternate plotarea background colors
            plotarea.setBackground(0xffffff, 0xe0e0e0)
        else
            # Use a dark background palette
            c.setColors(ChartDirector::whiteOnBlackPalette)
        end

        # Set the labels on the x axis
        c.xAxis().setLabels(labels)

        # Add a color bar layer using the given data. Use a 1 pixel 3D border for the bars.
        c.addBarLayer3(data).setBorderColor(-1, 1)

        # Output the chart
        send_data(c.makeChart2(ChartDirector::PNG), :type => "image/png", :disposition => "inline")

    end

end |
[Ruby On Rails Version - View] app/views/templates/chartview.html.erb
<html>
<body style="margin:5px 0px 0px 5px">

<!-- Title -->
<div style="font-size:18pt; font-family:verdana; font-weight:bold">
    <%= @title %>
</div>
<hr style="border:solid 1px #000080" />

<!-- Source Code Listing Link -->
<div style="font-size:9pt; font-family:verdana; margin-bottom:1.5em">
    <%= link_to "Source Code Listing",
        :controller => "cddemo", :action => "viewsource",
        :ctrl_file => @ctrl_file, :view_file => File.expand_path(__FILE__) %>
</div>

<!-- Create one or more IMG tags to display the demo chart(s) -->
<% 0.upto(@noOfCharts - 1) do |i| %>
    <img src="<%= url_for(:action => "getchart", :img => i) %>">
<% end %>

</body>
</html> |
[Command Line Version] rubydemo/background.rb
#!/usr/bin/env ruby
require("chartdirector")

def createChart(chartIndex)

    # The data for the chart
    data = [85, 156, 179.5, 211, 123]
    labels = ["Mon", "Tue", "Wed", "Thu", "Fri"]

    # Create a XYChart object of size 270 x 270 pixels
    c = ChartDirector::XYChart.new(270, 270)

    # Set the plot area at (40, 32) and of size 200 x 200 pixels
    plotarea = c.setPlotArea(40, 32, 200, 200)

    # Set the background style based on the input parameter
    if chartIndex == 0
        # Has wallpaper image
        c.setWallpaper("tile.gif")
    elsif chartIndex == 1
        # Use a background image as the plot area background
        plotarea.setBackground2("bg.png")
    elsif chartIndex == 2
        # Use white (0xffffff) and grey (0xe0e0e0) as two alternate plotarea background colors
        plotarea.setBackground(0xffffff, 0xe0e0e0)
    else
        # Use a dark background palette
        c.setColors(ChartDirector::whiteOnBlackPalette)
    end

    # Set the labels on the x axis
    c.xAxis().setLabels(labels)

    # Add a color bar layer using the given data. Use a 1 pixel 3D border for the bars.
    c.addBarLayer3(data).setBorderColor(-1, 1)

    # Output the chart
    c.makeChart("background%s.png" % chartIndex)
end

createChart(0)
createChart(1)
createChart(2)
createChart(3) |
© 2017 Advanced Software Engineering Limited. All rights reserved.