ChartDirector 6.0 (Ruby Edition)

Box-Whisker Chart (1)


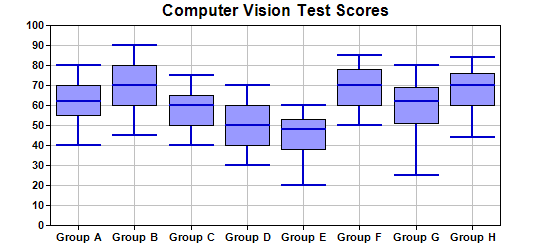
This example demonstrates creating a box-whisker chart.

A standard box-whisker chart plots up to 5 data sets using box-whisker symbols. The 5 data sets are sometimes called the maximum, 3rd quartile, median, 1st quartile and minimum, although they can represent any kind of quantities.

In a box-whisker symbol, the 3rd and 1st quartile values are represented as a box. The maximum, minimum and median values are represented as horizontal marks. There is a vertical line joining the maximum and minimum.

In ChartDirector, XYChart.addBoxWhiskerLayer and XYChart.addBoxWhiskerLayer2 may be used to create single-color and multi-color box-whisker layers.

When creating a box-whisker layer, not all 5 data sets need to be present. One common usage is to provide only the 3rd and 1st quartile data (leave other arguments as empty arrays) to draw only the "box" part of the chart. This will result in a floating box chart. Another common usage is to provide only the maximum and minimum values to draw only the "whisker" part of the chart. They are useful as "error symbols". (See Line with Error Symbols for an example.) You may even provide only the median data to draw floating mark lines.

Source Code Listing

[Ruby On Rails Version - Controller] app/controllers/boxwhisker_controller.rb
require("chartdirector")

class BoxwhiskerController < ApplicationController

    def index()
        @title = "Box-Whisker Chart (1)"
        @ctrl_file = File.expand_path(__FILE__)
        @noOfCharts = 1
        render :template => "templates/chartview"
    end

    #
    # Render and deliver the chart
    #
    def getchart()
        # Sample data for the Box-Whisker chart. Represents the minimum, 1st quartile, medium, 3rd
        # quartile and maximum values of some quantities
        q0Data = [40, 45, 40, 30, 20, 50, 25, 44]
        q1Data = [55, 60, 50, 40, 38, 60, 51, 60]
        q2Data = [62, 70, 60, 50, 48, 70, 62, 70]
        q3Data = [70, 80, 65, 60, 53, 78, 69, 76]
        q4Data = [80, 90, 75, 70, 60, 85, 80, 84]

        # The labels for the chart
        labels = ["Group A", "Group B", "Group C", "Group D", "Group E", "Group F", "Group G",
            "Group H"]

        # Create a XYChart object of size 550 x 250 pixels
        c = ChartDirector::XYChart.new(550, 250)

        # Set the plotarea at (50, 25) and of size 450 x 200 pixels. Enable both horizontal and
        # vertical grids by setting their colors to grey (0xc0c0c0)
        c.setPlotArea(50, 25, 450, 200).setGridColor(0xc0c0c0, 0xc0c0c0)

        # Add a title to the chart
        c.addTitle("Computer Vision Test Scores")

        # Set the labels on the x axis and the font to Arial Bold
        c.xAxis().setLabels(labels).setFontStyle("arialbd.ttf")

        # Set the font for the y axis labels to Arial Bold
        c.yAxis().setLabelStyle("arialbd.ttf")

        # Add a Box Whisker layer using light blue 0x9999ff as the fill color and blue (0xcc) as the
        # line color. Set the line width to 2 pixels
        c.addBoxWhiskerLayer(q3Data, q1Data, q4Data, q0Data, q2Data, 0x9999ff, 0x0000cc
            ).setLineWidth(2)

        # Output the chart
        send_data(c.makeChart2(ChartDirector::PNG), :type => "image/png", :disposition => "inline")

    end

end

[Ruby On Rails Version - View] app/views/templates/chartview.html.erb
<html>
<body style="margin:5px 0px 0px 5px">

<!-- Title -->
<div style="font-size:18pt; font-family:verdana; font-weight:bold">
    <%= @title %>
</div>
<hr style="border:solid 1px #000080" />

<!-- Source Code Listing Link -->
<div style="font-size:9pt; font-family:verdana; margin-bottom:1.5em">
    <%= link_to "Source Code Listing", 
        :controller => "cddemo", :action => "viewsource",
        :ctrl_file => @ctrl_file, :view_file => File.expand_path(__FILE__) %>
</div>

<!-- Create one or more IMG tags to display the demo chart(s) -->
<% 0.upto(@noOfCharts - 1) do |i| %>
    <img src="<%= url_for(:action => "getchart", :img => i) %>">
<% end %>

</body>
</html>

[Command Line Version] rubydemo/boxwhisker.rb
#!/usr/bin/env ruby
require("chartdirector")

# Sample data for the Box-Whisker chart. Represents the minimum, 1st quartile, medium, 3rd quartile
# and maximum values of some quantities
q0Data = [40, 45, 40, 30, 20, 50, 25, 44]
q1Data = [55, 60, 50, 40, 38, 60, 51, 60]
q2Data = [62, 70, 60, 50, 48, 70, 62, 70]
q3Data = [70, 80, 65, 60, 53, 78, 69, 76]
q4Data = [80, 90, 75, 70, 60, 85, 80, 84]

# The labels for the chart
labels = ["Group A", "Group B", "Group C", "Group D", "Group E", "Group F", "Group G", "Group H"]

# Create a XYChart object of size 550 x 250 pixels
c = ChartDirector::XYChart.new(550, 250)

# Set the plotarea at (50, 25) and of size 450 x 200 pixels. Enable both horizontal and vertical
# grids by setting their colors to grey (0xc0c0c0)
c.setPlotArea(50, 25, 450, 200).setGridColor(0xc0c0c0, 0xc0c0c0)

# Add a title to the chart
c.addTitle("Computer Vision Test Scores")

# Set the labels on the x axis and the font to Arial Bold
c.xAxis().setLabels(labels).setFontStyle("arialbd.ttf")

# Set the font for the y axis labels to Arial Bold
c.yAxis().setLabelStyle("arialbd.ttf")

# Add a Box Whisker layer using light blue 0x9999ff as the fill color and blue (0xcc) as the line
# color. Set the line width to 2 pixels
c.addBoxWhiskerLayer(q3Data, q1Data, q4Data, q0Data, q2Data, 0x9999ff, 0x0000cc).setLineWidth(2)

# Output the chart
c.makeChart("boxwhisker.png")