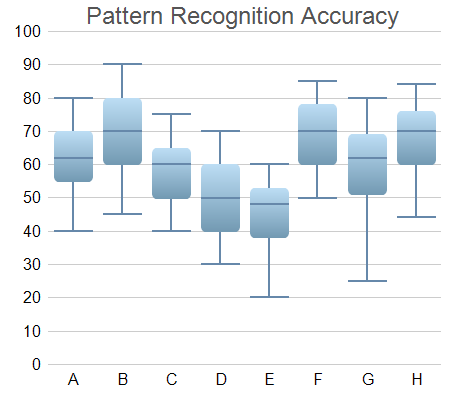
This example extends the Box-Whisker Chart (1) example to demonstrates various methods to control the chart appearance, including using different colors and font size, and using gradient shading and rounded corners for the boxes.
ChartDirector 6.0 (Ruby Edition)
Box-Whisker Chart (2)
Source Code Listing
require("chartdirector")

class Boxwhisker2Controller < ApplicationController

    def index()
        @title = "Box-Whisker Chart (2)"
        @ctrl_file = File.expand_path(__FILE__)
        @noOfCharts = 1
        render :template => "templates/chartview"
    end

    #
    # Render and deliver the chart
    #
    def getchart()
        # Sample data for the Box-Whisker chart. Represents the minimum, 1st quartile, medium, 3rd
        # quartile and maximum values of some quantities
        q0Data = [40, 45, 40, 30, 20, 50, 25, 44]
        q1Data = [55, 60, 50, 40, 38, 60, 51, 60]
        q2Data = [62, 70, 60, 50, 48, 70, 62, 70]
        q3Data = [70, 80, 65, 60, 53, 78, 69, 76]
        q4Data = [80, 90, 75, 70, 60, 85, 80, 84]

        # The labels for the chart
        labels = ["A", "B", "C", "D", "E", "F", "G", "H"]

        # Create a XYChart object of size 450 x 400 pixels
        c = ChartDirector::XYChart.new(450, 400)

        # Set the plotarea at (50, 30) and of size 380 x 340 pixels, with transparent background and
        # border and light grey (0xcccccc) horizontal grid lines
        c.setPlotArea(50, 30, 380, 340, ChartDirector::Transparent, -1, ChartDirector::Transparent,
            0xcccccc)

        # Add a title box using grey (0x555555) 18pt Arial font
        title = c.addTitle("     Pattern Recognition Accuracy", "arial.ttf", 18, 0x555555)

        # Set the x and y axis stems to transparent and the label font to 12pt Arial
        c.xAxis().setColors(ChartDirector::Transparent)
        c.yAxis().setColors(ChartDirector::Transparent)
        c.xAxis().setLabelStyle("arial.ttf", 12)
        c.yAxis().setLabelStyle("arial.ttf", 12)

        # Set the labels on the x axis
        c.xAxis().setLabels(labels)

        # For the automatic y-axis labels, set the minimum spacing to 30 pixels.
        c.yAxis().setTickDensity(30)

        # Add a box whisker layer using light blue (0x99ccee) for the fill color and blue (0x6688aa)
        # for the whisker color. Set line width to 2 pixels. Use rounded corners and bar lighting
        # effect.
        b = c.addBoxWhiskerLayer(q3Data, q1Data, q4Data, q0Data, q2Data, 0x99ccee, 0x6688aa)
        b.setLineWidth(2)
        b.setRoundedCorners()
        b.setBorderColor(ChartDirector::Transparent, ChartDirector::barLighting())

        # Adjust the plot area to fit under the title with 10-pixel margin on the other three sides.
        c.packPlotArea(10, title.getHeight(), c.getWidth() - 10, c.getHeight() - 10)

        # Output the chart
        send_data(c.makeChart2(ChartDirector::PNG), :type => "image/png", :disposition => "inline")

    end

end |
<html>
<body style="margin:5px 0px 0px 5px">

<!-- Title -->
<div style="font-size:18pt; font-family:verdana; font-weight:bold">
    <%= @title %>
</div>
<hr style="border:solid 1px #000080" />

<!-- Source Code Listing Link -->
<div style="font-size:9pt; font-family:verdana; margin-bottom:1.5em">
    <%= link_to "Source Code Listing",
        :controller => "cddemo", :action => "viewsource",
        :ctrl_file => @ctrl_file, :view_file => File.expand_path(__FILE__) %>
</div>

<!-- Create one or more IMG tags to display the demo chart(s) -->
<% 0.upto(@noOfCharts - 1) do |i| %>
    <img src="<%= url_for(:action => "getchart", :img => i) %>">
<% end %>

</body>
</html> |
#!/usr/bin/env ruby
require("chartdirector")

# Sample data for the Box-Whisker chart. Represents the minimum, 1st quartile, medium, 3rd quartile
# and maximum values of some quantities
q0Data = [40, 45, 40, 30, 20, 50, 25, 44]
q1Data = [55, 60, 50, 40, 38, 60, 51, 60]
q2Data = [62, 70, 60, 50, 48, 70, 62, 70]
q3Data = [70, 80, 65, 60, 53, 78, 69, 76]
q4Data = [80, 90, 75, 70, 60, 85, 80, 84]

# The labels for the chart
labels = ["A", "B", "C", "D", "E", "F", "G", "H"]

# Create a XYChart object of size 450 x 400 pixels
c = ChartDirector::XYChart.new(450, 400)

# Set the plotarea at (50, 30) and of size 380 x 340 pixels, with transparent background and border
# and light grey (0xcccccc) horizontal grid lines
c.setPlotArea(50, 30, 380, 340, ChartDirector::Transparent, -1, ChartDirector::Transparent, 0xcccccc
    )

# Add a title box using grey (0x555555) 18pt Arial font
title = c.addTitle("     Pattern Recognition Accuracy", "arial.ttf", 18, 0x555555)

# Set the x and y axis stems to transparent and the label font to 12pt Arial
c.xAxis().setColors(ChartDirector::Transparent)
c.yAxis().setColors(ChartDirector::Transparent)
c.xAxis().setLabelStyle("arial.ttf", 12)
c.yAxis().setLabelStyle("arial.ttf", 12)

# Set the labels on the x axis
c.xAxis().setLabels(labels)

# For the automatic y-axis labels, set the minimum spacing to 30 pixels.
c.yAxis().setTickDensity(30)

# Add a box whisker layer using light blue (0x99ccee) for the fill color and blue (0x6688aa) for the
# whisker color. Set line width to 2 pixels. Use rounded corners and bar lighting effect.
b = c.addBoxWhiskerLayer(q3Data, q1Data, q4Data, q0Data, q2Data, 0x99ccee, 0x6688aa)
b.setLineWidth(2)
b.setRoundedCorners()
b.setBorderColor(ChartDirector::Transparent, ChartDirector::barLighting())

# Adjust the plot area to fit under the title with 10-pixel margin on the other three sides.
c.packPlotArea(10, title.getHeight(), c.getWidth() - 10, c.getHeight() - 10)

# Output the chart
c.makeChart("boxwhisker2.png") |