require("chartdirector")
class ColorvbarmeterController < ApplicationController
def index()
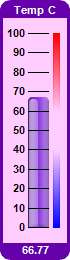
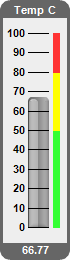
@title = "Color Vertical Bar Meters"
@ctrl_file = File.expand_path(__FILE__)
@noOfCharts = 6
render :template => "templates/chartview"
end
#
# Render and deliver the chart
#
def getchart()
# This script can draw different charts depending on the chartIndex
chartIndex = (params["img"]).to_i
# The value to display on the meter
value = 66.77
# The background, border and bar colors of the meters
bgColor = [0xcce4ff, 0xccffcc, 0xffdddd, 0xffffaa, 0xffccff, 0xeeeeee]
borderColor = [0x000088, 0x006600, 0x880000, 0xee6600, 0x6600aa, 0x666666]
barColor = [0x2299ff, 0x00ee00, 0xee4455, 0xff8800, 0x8833dd, 0x888888]
# Create a LinearMeter object of size 70 x 260 pixels with a 3-pixel thick rounded frame
m = ChartDirector::LinearMeter.new(70, 260, bgColor[chartIndex], borderColor[chartIndex])
m.setRoundedFrame(ChartDirector::Transparent)
m.setThickFrame(3)
# Set the scale region top-left corner at (28, 33), with size of 20 x 194 pixels. The scale
# labels are located on the left (default - implies vertical meter).
m.setMeter(28, 33, 20, 194)
# Set meter scale from 0 - 100, with a tick every 10 units
m.setScale(0, 100, 10)
# Demostrate different types of color scales
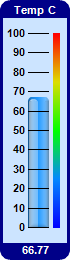
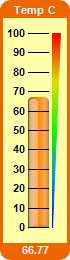
smoothColorScale = [0, 0x0000ff, 25, 0x0088ff, 50, 0x00ff00, 75, 0xdddd00, 100, 0xff0000]
stepColorScale = [0, 0x33ff33, 50, 0xffff00, 80, 0xff3333, 100]
highLowColorScale = [0, 0x0000ff, 40, ChartDirector::Transparent, 60,
ChartDirector::Transparent, 100, 0xff0000]
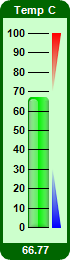
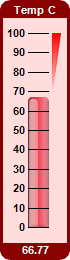
highColorScale = [70, ChartDirector::Transparent, 100, 0xff0000]
lowColorScale = [0, 0x0000ff, 30, ChartDirector::Transparent]
if chartIndex == 0
# Add a 6-pixel thick smooth color scale at x = 53 (right of meter scale)
m.addColorScale(smoothColorScale, 53, 6)
elsif chartIndex == 1
# Add a high only color scale at x = 52 (right of meter scale) with thickness varying
# from 0 to 8
m.addColorScale(highColorScale, 52, 0, 52, 8)
# Add a low only color scale at x = 52 (right of meter scale) with thickness varying
# from 8 to 0
m.addColorScale(lowColorScale, 52, 8, 52, 0)
elsif chartIndex == 2
# Add a high only color scale at x = 52 (right of meter scale) with thickness varying
# from 0 to 8
m.addColorScale(highColorScale, 52, 0, 52, 8)
elsif chartIndex == 3
# Add a smooth color scale at x = 52 (right of meter scale) with thickness varying from
# 0 to 8
m.addColorScale(smoothColorScale, 52, 0, 52, 8)
elsif chartIndex == 4
# Add a 6-pixel thick high/low color scale at x = 53 (right of meter scale)
m.addColorScale(highLowColorScale, 53, 6)
else
# Add a 6-pixel thick step color scale at x = 53 (right of meter scale)
m.addColorScale(stepColorScale, 53, 6)
end
# Add a bar from 0 to value with glass effect and 4 pixel rounded corners
m.addBar(0, value, barColor[chartIndex], ChartDirector::glassEffect(
ChartDirector::NormalGlare, ChartDirector::Left), 4)
# Add a title using white (0xffffff) 8pt Arial Bold font with a border color background
m.addTitle("Temp C", "arialbd.ttf", 8, 0xffffff).setBackground(borderColor[chartIndex])
# Add a bottom title using white (0xffffff) 8pt Arial Bold font with a border color
# background to display the value
m.addTitle2(ChartDirector::Bottom, m.formatValue(value, "2"), "arialbd.ttf", 8, 0xffffff
).setBackground(borderColor[chartIndex])
# Output the chart
send_data(m.makeChart2(ChartDirector::PNG), :type => "image/png", :disposition => "inline")
end
end |