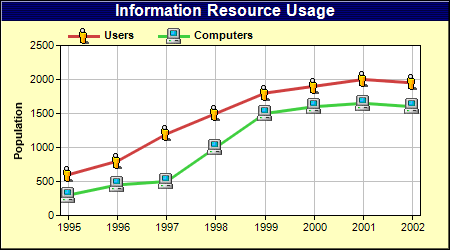
This example demonstrates loading external image files as data symbols by using DataSet.setDataSymbol2.
ChartDirector 6.0 (Ruby Edition)
Custom Symbols
Source Code Listing
require("chartdirector")

class CustomsymbollineController < ApplicationController

    def index()
        @title = "Custom Symbols"
        @ctrl_file = File.expand_path(__FILE__)
        @noOfCharts = 1
        render :template => "templates/chartview"
    end

    #
    # Render and deliver the chart
    #
    def getchart()
        # The data for the chart
        data0 = [600, 800, 1200, 1500, 1800, 1900, 2000, 1950]
        data1 = [300, 450, 500, 1000, 1500, 1600, 1650, 1600]

        # The labels for the chart
        labels = ["1995", "1996", "1997", "1998", "1999", "2000", "2001", "2002"]

        # Create a XYChart object of size 450 x 250 pixels, with a pale yellow (0xffffc0)
        # background, a black border, and 1 pixel 3D border effect.
        c = ChartDirector::XYChart.new(450, 250, 0xffffc0, 0, 1)

        # Set the plotarea at (60, 45) and of size 360 x 170 pixels, using white (0xffffff) as the
        # plot area background color. Turn on both horizontal and vertical grid lines with light
        # grey color (0xc0c0c0)
        c.setPlotArea(60, 45, 360, 170, 0xffffff, -1, -1, 0xc0c0c0, -1)

        # Add a legend box at (60, 20) (top of the chart) with horizontal layout. Use 8pt Arial Bold
        # font. Set the background and border color to Transparent.
        c.addLegend(60, 20, false, "arialbd.ttf", 8).setBackground(ChartDirector::Transparent)

        # Add a title to the chart using 12pt Arial Bold/white font. Use a 1 x 2 bitmap pattern as
        # the background.
        c.addTitle("Information Resource Usage", "arialbd.ttf", 12, 0xffffff).setBackground(
            c.patternColor([0x000040, 0x000080], 2))

        # Set the labels on the x axis
        c.xAxis().setLabels(labels)

        # Reserve 8 pixels margins at both side of the x axis to avoid the first and last symbols
        # drawing outside of the plot area
        c.xAxis().setMargin(8, 8)

        # Add a title to the y axis
        c.yAxis().setTitle("Population")

        # Add a line layer to the chart
        layer = c.addLineLayer2()

        # Add the first line using small_user.png as the symbol.
        layer.addDataSet(data0, 0xcf4040, "Users").setDataSymbol2(
            File.dirname(__FILE__) + "/small_user.png")

        # Add the first line using small_computer.png as the symbol.
        layer.addDataSet(data1, 0x40cf40, "Computers").setDataSymbol2(
            File.dirname(__FILE__) + "/small_computer.png")

        # Set the line width to 3 pixels
        layer.setLineWidth(3)

        # Output the chart
        send_data(c.makeChart2(ChartDirector::PNG), :type => "image/png", :disposition => "inline")

    end

end |
<html>
<body style="margin:5px 0px 0px 5px">

<!-- Title -->
<div style="font-size:18pt; font-family:verdana; font-weight:bold">
    <%= @title %>
</div>
<hr style="border:solid 1px #000080" />

<!-- Source Code Listing Link -->
<div style="font-size:9pt; font-family:verdana; margin-bottom:1.5em">
    <%= link_to "Source Code Listing",
        :controller => "cddemo", :action => "viewsource",
        :ctrl_file => @ctrl_file, :view_file => File.expand_path(__FILE__) %>
</div>

<!-- Create one or more IMG tags to display the demo chart(s) -->
<% 0.upto(@noOfCharts - 1) do |i| %>
    <img src="<%= url_for(:action => "getchart", :img => i) %>">
<% end %>

</body>
</html> |
#!/usr/bin/env ruby
require("chartdirector")

# The data for the chart
data0 = [600, 800, 1200, 1500, 1800, 1900, 2000, 1950]
data1 = [300, 450, 500, 1000, 1500, 1600, 1650, 1600]

# The labels for the chart
labels = ["1995", "1996", "1997", "1998", "1999", "2000", "2001", "2002"]

# Create a XYChart object of size 450 x 250 pixels, with a pale yellow (0xffffc0) background, a
# black border, and 1 pixel 3D border effect.
c = ChartDirector::XYChart.new(450, 250, 0xffffc0, 0, 1)

# Set the plotarea at (60, 45) and of size 360 x 170 pixels, using white (0xffffff) as the plot area
# background color. Turn on both horizontal and vertical grid lines with light grey color (0xc0c0c0)
c.setPlotArea(60, 45, 360, 170, 0xffffff, -1, -1, 0xc0c0c0, -1)

# Add a legend box at (60, 20) (top of the chart) with horizontal layout. Use 8pt Arial Bold font.
# Set the background and border color to Transparent.
c.addLegend(60, 20, false, "arialbd.ttf", 8).setBackground(ChartDirector::Transparent)

# Add a title to the chart using 12pt Arial Bold/white font. Use a 1 x 2 bitmap pattern as the
# background.
c.addTitle("Information Resource Usage", "arialbd.ttf", 12, 0xffffff).setBackground(c.patternColor([
    0x000040, 0x000080], 2))

# Set the labels on the x axis
c.xAxis().setLabels(labels)

# Reserve 8 pixels margins at both side of the x axis to avoid the first and last symbols drawing
# outside of the plot area
c.xAxis().setMargin(8, 8)

# Add a title to the y axis
c.yAxis().setTitle("Population")

# Add a line layer to the chart
layer = c.addLineLayer2()

# Add the first line using small_user.png as the symbol.
layer.addDataSet(data0, 0xcf4040, "Users").setDataSymbol2("small_user.png")

# Add the first line using small_computer.png as the symbol.
layer.addDataSet(data1, 0x40cf40, "Computers").setDataSymbol2("small_computer.png")

# Set the line width to 3 pixels
layer.setLineWidth(3)

# Output the chart
c.makeChart("customsymbolline.png") |