In this section, we will present an example that employs both database and image maps.
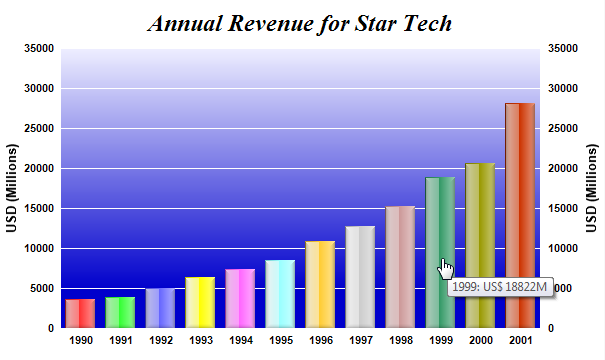
This example displays a bar chart that shows the revenue for the last 10 years. When the user clicks on a bar, it will "drill down" to another bar chart showing the monthly revenue for the year represented by the bar clicked. All data come from a database.
The code that creates the clickable bar chart for the last 10 years are as follows.
[Ruby On Rails Version - Controller] app/controllers/dbdemo3_controller.rb
require("chartdirector")

class Dbdemo3Controller < ApplicationController
    include ChartDirector::InteractiveChartSupport

    def index()
        @ctrl_file = File.expand_path(__FILE__)

        # SQL statement to get the revenue for the 12 years from 1990 to 2001
        sQL =
            "Select Sum(Software + Hardware + Services) As annualRevenue, strftime('%Y', " \
            "TimeStamp) As theYear From revenues Where strftime('%Y', TimeStamp) Between '1990' " \
            "And '2001' Group By strftime('%Y', TimeStamp) Order By strftime('%Y', TimeStamp)"

        #
        # Connect to database and read the query result into arrays
        #

        records = Revenue.find_by_sql(sQL)

        revenue = []
        timestamp = []
        records.each do |r|
            revenue.push(r.annualRevenue.to_f)
            timestamp.push(r.theYear)
        end

        #
        # Now we have read data into arrays, we can draw the chart using ChartDirector
        #

        # Create a XYChart object of size 600 x 360 pixels
        c = ChartDirector::XYChart.new(600, 360)

        # Set the plotarea at (60, 40) and of size 480 x 280 pixels. Use a vertical gradient color
        # from light blue (eeeeff) to deep blue (0000cc) as background. Set border and grid lines to
        # white (ffffff).
        c.setPlotArea(60, 40, 480, 280, c.linearGradientColor(60, 40, 60, 280, 0xeeeeff, 0x0000cc),
            -1, 0xffffff, 0xffffff)

        # Add a title to the chart using 18pt Times Bold Italic font
        c.addTitle("Annual Revenue for Star Tech", "timesbi.ttf", 18)

        # Add a multi-color bar chart layer using the supplied data
        layer = c.addBarLayer3(revenue)

        # Use glass lighting effect with light direction from the left
        layer.setBorderColor(ChartDirector::Transparent, ChartDirector::glassEffect(
            ChartDirector::NormalGlare, ChartDirector::Left))

        # Set the x axis labels
        c.xAxis().setLabels(timestamp)

        # Set y-axis tick density to 30 pixels. ChartDirector auto-scaling will use this as the
        # guideline when putting ticks on the y-axis.
        c.yAxis().setTickDensity(30)

        # Synchronize the left and right y-axes
        c.syncYAxis()

        # Set the y axes titles with 10pt Arial Bold font
        c.yAxis().setTitle("USD (Millions)", "arialbd.ttf", 10)
        c.yAxis2().setTitle("USD (Millions)", "arialbd.ttf", 10)

        # Set all axes to transparent
        c.xAxis().setColors(ChartDirector::Transparent)
        c.yAxis().setColors(ChartDirector::Transparent)
        c.yAxis2().setColors(ChartDirector::Transparent)

        # Set the label styles of all axes to 8pt Arial Bold font
        c.xAxis().setLabelStyle("arialbd.ttf", 8)
        c.yAxis().setLabelStyle("arialbd.ttf", 8)
        c.yAxis2().setLabelStyle("arialbd.ttf", 8)

        # Create the image
        session["chart1"] = c.makeChart2(ChartDirector::PNG)

        # Create an image map for the chart
        @imageMap = c.getHTMLImageMap(url_for(:controller => "dbdemo3a"), "",
            "title='{xLabel}: US$ {value|0}M'")
    end

end |
[Ruby On Rails Version - View] app/views/dbdemo3/index.html.erb
<html>
<body style="margin:5px 0px 0px 5px">
<div style="font-size:18pt; font-family:verdana; font-weight:bold">
    Database Clickable Charts
</div>
<hr style="border:solid 1px #000080" />
<div style="font-size:10pt; font-family:verdana; width:600px; margin-bottom:20px">
    The example demonstrates creating a clickable chart using data from a database.
    Click on a bar below to "drill down" onto a particular year.
<br /><br />
<%= link_to "Source Code Listing", :controller => "cddemo", :action => "viewsource",
    :ctrl_file => @ctrl_file, :view_file => File.expand_path(__FILE__) %>
</div>

<img src="<%= url_for(:action => 'get_session_data', :id => 'chart1',
    :nocache => rand) %>" border="0" usemap="#map1">
<map name="map1">
<%= raw(@imageMap) %>
</map>

</body>
</html> |
The above code first performs a database query and read the data into arrays. It then uses the data to create a bar chart. The chart is saved in a session variable. An <IMG> tag is used in the view to retrieve the chart with the "get_session_data" action. The "get_session_data" action is implemented in the InteractiveChartSupport class that is included as a mixin in the controller.
When the user clicks on the bar chart, the "dbdemo3a" controller will be invoked with a number of HTTP query parameters to indicate which bar the user has clicked. In particular, the xLabel parameter will contain the x-axis label for the bar clicked. With this parameter, the "dbdemo3a" controller can determine which year the user has clicked. It can then query the database for the data in that year, and produces the bar chart for that year.
In this example, the "dbdemo3a" controller will produce another clickable chart using the "xystub" controller as the handler.
[Ruby On Rails Version - Controller] app/controllers/dbdemo3a_controller.rb
require("chartdirector")

class Dbdemo3aController < ApplicationController
    include ChartDirector::InteractiveChartSupport

    def index()
        @ctrl_file = File.expand_path(__FILE__)

        #
        # Displays the monthly revenue for the selected year. The selected year should be passed in
        # as a query parameter called "xLabel"
        #
        selectedYear = params["xLabel"]

        #
        # Query database for the selected year and read results into arrays
        #

        records = Revenue.find(:all,
            :conditions => ["strftime('%Y', TimeStamp) = ?", selectedYear],
            :order => "TimeStamp")

        software = []
        hardware = []
        services = []
        records.each do |r|
            software.push(r.Software)
            hardware.push(r.Hardware)
            services.push(r.Services)
        end

        #
        # Now we have read data into arrays, we can draw the chart using ChartDirector
        #

        # Create a XYChart object of size 600 x 360 pixels
        c = ChartDirector::XYChart.new(600, 360)

        # Set the plotarea at (60, 50) and of size 480 x 270 pixels. Use a vertical gradient color
        # from light blue (eeeeff) to deep blue (0000cc) as background. Set border and grid lines to
        # white (ffffff).
        c.setPlotArea(60, 50, 480, 270, c.linearGradientColor(60, 50, 60, 270, 0xeeeeff, 0x0000cc),
            -1, 0xffffff, 0xffffff)

        # Add a title to the chart using 15pt Times Bold Italic font
        c.addTitle(sprintf("Global Revenue for Year %s", selectedYear), "timesbi.ttf", 18)

        # Add a legend box at (60, 25) (top of the plotarea) with 9pt Arial Bold font
        c.addLegend(60, 25, false, "arialbd.ttf", 9).setBackground(ChartDirector::Transparent)

        # Add a line chart layer using the supplied data
        layer = c.addLineLayer2()
        layer.addDataSet(software, 0xffaa00, "Software").setDataSymbol(ChartDirector::CircleShape, 9
            )
        layer.addDataSet(hardware, 0x00ff00, "Hardware").setDataSymbol(ChartDirector::DiamondShape,
            11)
        layer.addDataSet(services, 0xff0000, "Services").setDataSymbol(ChartDirector::Cross2Shape(),
            11)

        # Set the line width to 3 pixels
        layer.setLineWidth(3)

        # Set the x axis labels. In this example, the labels must be Jan - Dec.
        labels = ["Jan", "Feb", "Mar", "Apr", "May", "Jun", "Jul", "Aug", "Sept", "Oct", "Nov",
            "Dec"]
        c.xAxis().setLabels(labels)

        # Set y-axis tick density to 30 pixels. ChartDirector auto-scaling will use this as the
        # guideline when putting ticks on the y-axis.
        c.yAxis().setTickDensity(30)

        # Synchronize the left and right y-axes
        c.syncYAxis()

        # Set the y axes titles with 10pt Arial Bold font
        c.yAxis().setTitle("USD (Millions)", "arialbd.ttf", 10)
        c.yAxis2().setTitle("USD (Millions)", "arialbd.ttf", 10)

        # Set all axes to transparent
        c.xAxis().setColors(ChartDirector::Transparent)
        c.yAxis().setColors(ChartDirector::Transparent)
        c.yAxis2().setColors(ChartDirector::Transparent)

        # Set the label styles of all axes to 8pt Arial Bold font
        c.xAxis().setLabelStyle("arialbd.ttf", 8)
        c.yAxis().setLabelStyle("arialbd.ttf", 8)
        c.yAxis2().setLabelStyle("arialbd.ttf", 8)

        # Create the image and save it in a temporary location
        session["chart1"] = c.makeChart2(ChartDirector::PNG)

        # Create an image map for the chart
        @imageMap = c.getHTMLImageMap(url_for(:controller => "xystub"), "",
            "title='{dataSetName} @ {xLabel} = USD {value|0}M'")
    end

end |
[Ruby On Rails Version - View] app/views/dbdemo3a/index.html.erb
<html>
<body style="margin:5px 0px 0px 5px">
<div style="font-size:18pt; font-family:verdana; font-weight:bold">
    Database Clickable Charts
</div>
<hr style="border:solid 1px #000080" />
<div style="font-size:10pt; font-family:verdana; width:600px; margin-bottom:20px">
    You have click the bar for the year <%= params["xLabel"] %>.
    Below is the "drill-down" chart showing the monthly details.
<br /><br />
<%= link_to "Source Code Listing", :controller => "cddemo", :action => "viewsource",
    :ctrl_file => @ctrl_file, :view_file => File.expand_path(__FILE__) %>
</div>

<img src="<%= url_for(:action => 'get_session_data', :id => 'chart1',
    :nocache => rand) %>" border="0" usemap="#map1">
<map name="map1">
<%= raw(@imageMap) %>
</map>

</body>
</html> |
For demo purpose, the "xystub" controller simply displays information on what is clicked. It's source code is as follows.
[Ruby On Rails Version - Controller] app/controllers/xystub_controller.rb
class XystubController < ApplicationController
    def index()
        @ctrl_file = File.expand_path(__FILE__)
    end
end |
[Ruby On Rails Version - View] app/views/xystub/index.html.erb
<html>
<body style="margin:5px 0px 0px 5px">
<div style="font-size:18pt; font-family:verdana; font-weight:bold">
    Simple Clickable XY Chart Handler
</div>
<hr style="border:solid 1px #000080" />
<div style="font-size:10pt; font-family:verdana; margin-bottom:20px">
    <%= link_to "Source Code Listing",
        :controller => "cddemo", :action => "viewsource",
        :ctrl_file => @ctrl_file, :view_file => File.expand_path(__FILE__) %>
</div>
<div style="font-size:10pt; font-family:verdana;">
<b>You have clicked on the following chart element :</b><br />
<ul>
    <li>Data Set : <%= params["dataSetName"] %></li>
    <li>X Position : <%= params["x"] %></li>
    <li>X Label : <%= params["xLabel"] %></li>
    <li>Data Value : <%= params["value"] %></li>
</ul>
</div>
</body>
</html> |