In this example, we will demonstrate how to produce multiple charts on the same page, in which the data come from the same database query.
Note that although the database sample codes are based on Ruby On Rails, the techniques are equally applicable to standalone Ruby applications.
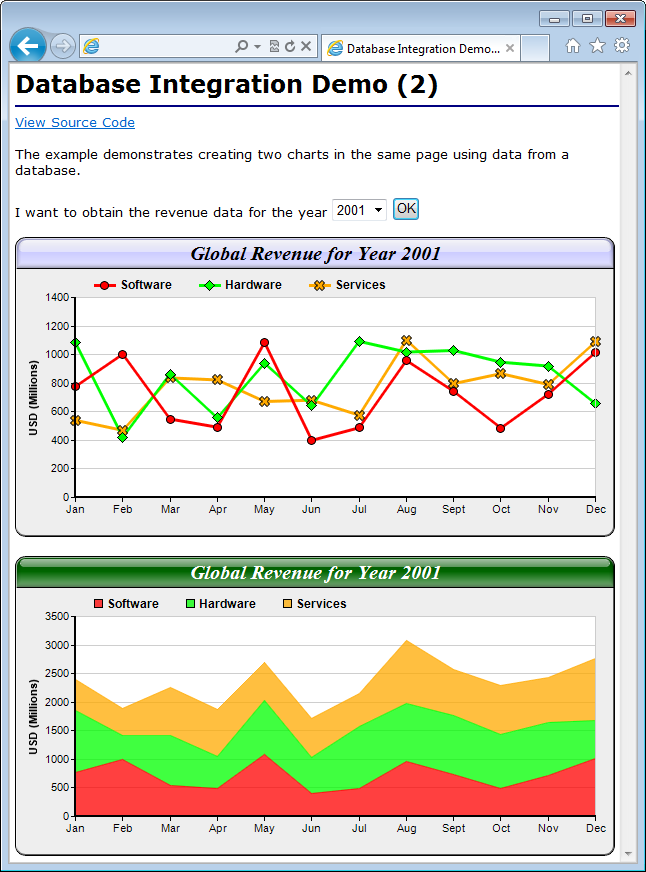
As similar to the last example, the user will select a year from a HTML form and press OK. The web server will query a database to obtain the necessary data, and return a web page containing two charts about the selected year.
[Ruby On Rails Version - Controller] app/controllers/dbdemo2_controller.rb
require("chartdirector")

class Dbdemo2Controller < ApplicationController

    def index()
        @ctrl_file = File.expand_path(__FILE__)

        selectedYear = (params["date"] && params["date"]["year"]) || "2001"

        #
        # Query database for the selected year and read results into arrays
        #

        records = Revenue.find(:all,
            :conditions => ["strftime('%Y', TimeStamp) = ?", selectedYear],
            :order => "TimeStamp")

        software = []
        hardware = []
        services = []
        records.each do |r|
            software.push(r.Software)
            hardware.push(r.Hardware)
            services.push(r.Services)
        end

        # Encode data into a query string to be passed to the chart creation methods
        @httpParam = sprintf("year=%s&software=%s&hardware=%s&services=%s", selectedYear,
            software.join(","), hardware.join(","), services.join(","))
    end

    #
    # Draw the first chart
    #
    def getchart1()
        # Retrieve the data from the query parameters
        selectedYear = params["year"].to_i
        software = params["software"].split(",").map! {|a| a.to_f }
        hardware = params["hardware"].split(",").map! {|a| a.to_f }
        services = params["services"].split(",").map! {|a| a.to_f }

        #
        # Now we obtained the data into arrays, we can draw the chart using ChartDirector
        #

        # Create a XYChart object of size 600 x 300 pixels, with a light grey (eeeeee) background,
        # black border, 1 pixel 3D border effect and rounded corners.
        c = ChartDirector::XYChart.new(600, 300, 0xeeeeee, 0x000000, 1)
        c.setRoundedFrame()

        # Set the plotarea at (60, 60) and of size 520 x 200 pixels. Set background color to white
        # (ffffff) and border and grid colors to grey (cccccc)
        c.setPlotArea(60, 60, 520, 200, 0xffffff, -1, 0xcccccc, 0xccccccc)

        # Add a title to the chart using 15pt Times Bold Italic font, with a light blue (ccccff)
        # background and with glass lighting effects.
        c.addTitle(sprintf("Global Revenue for Year %s", selectedYear), "timesbi.ttf", 15
            ).setBackground(0xccccff, 0x000000, ChartDirector::glassEffect())

        # Add a legend box at (70, 32) (top of the plotarea) with 9pt Arial Bold font
        c.addLegend(70, 32, false, "arialbd.ttf", 9).setBackground(ChartDirector::Transparent)

        # Add a line chart layer using the supplied data
        layer = c.addLineLayer2()
        layer.addDataSet(software, 0xff0000, "Software").setDataSymbol(ChartDirector::CircleShape, 9
            )
        layer.addDataSet(hardware, 0x00ff00, "Hardware").setDataSymbol(ChartDirector::DiamondShape,
            11)
        layer.addDataSet(services, 0xffaa00, "Services").setDataSymbol(ChartDirector::Cross2Shape(),
            11)

        # Set the line width to 3 pixels
        layer.setLineWidth(3)

        # Set the x axis labels. In this example, the labels must be Jan - Dec.
        labels = ["Jan", "Feb", "Mar", "Apr", "May", "Jun", "Jul", "Aug", "Sept", "Oct", "Nov",
            "Dec"]
        c.xAxis().setLabels(labels)

        # Set the y axis title
        c.yAxis().setTitle("USD (Millions)")

        # Set axes width to 2 pixels
        c.xAxis().setWidth(2)
        c.yAxis().setWidth(2)

        # output the chart
        send_data(c.makeChart2(ChartDirector::PNG), :type => "image/png",
            :disposition => "inline")
    end

    #
    # Draw the second chart
    #
    def getchart2()
        # Retrieve the data from the query parameters
        selectedYear = params["year"].to_i
        software = params["software"].split(",").map! {|a| a.to_f }
        hardware = params["hardware"].split(",").map! {|a| a.to_f }
        services = params["services"].split(",").map! {|a| a.to_f }

        #
        # Now we obtained the data into arrays, we can draw the chart using ChartDirector
        #

        # Create a XYChart object of size 600 x 300 pixels, with a light grey (eeeeee) background,
        # black border, 1 pixel 3D border effect and rounded corners.
        c = ChartDirector::XYChart.new(600, 300, 0xeeeeee, 0x000000, 1)
        c.setRoundedFrame()

        # Set the plotarea at (60, 60) and of size 520 x 200 pixels. Set background color to white
        # (ffffff) and border and grid colors to grey (cccccc)
        c.setPlotArea(60, 60, 520, 200, 0xffffff, -1, 0xcccccc, 0xccccccc)

        # Add a title to the chart using 15pt Times Bold Italic font, with a dark green (006600)
        # background and with glass lighting effects.
        c.addTitle(sprintf("Global Revenue for Year %s", selectedYear), "timesbi.ttf", 15, 0xffffff
            ).setBackground(0x006600, 0x000000, ChartDirector::glassEffect(
            ChartDirector::ReducedGlare))

        # Add a legend box at (70, 32) (top of the plotarea) with 9pt Arial Bold font
        c.addLegend(70, 32, false, "arialbd.ttf", 9).setBackground(ChartDirector::Transparent)

        # Add a stacked area chart layer using the supplied data
        layer = c.addAreaLayer2(ChartDirector::Stack)
        layer.addDataSet(software, 0x40ff0000, "Software")
        layer.addDataSet(hardware, 0x4000ff00, "Hardware")
        layer.addDataSet(services, 0x40ffaa00, "Services")

        # Set the area border color to the same as the fill color
        layer.setBorderColor(ChartDirector::SameAsMainColor)

        # Set the x axis labels. In this example, the labels must be Jan - Dec.
        labels = ["Jan", "Feb", "Mar", "Apr", "May", "Jun", "Jul", "Aug", "Sept", "Oct", "Nov",
            "Dec"]
        c.xAxis().setLabels(labels)

        # Set the y axis title
        c.yAxis().setTitle("USD (Millions)")

        # Set axes width to 2 pixels
        c.xAxis().setWidth(2)
        c.yAxis().setWidth(2)

        # output the chart
        send_data(c.makeChart2(ChartDirector::PNG), :type => "image/png",
            :disposition => "inline")
    end

end |
[Ruby On Rails Version - View] app/views/dbdemo2/index.html.erb
<html>
<body style="margin:5px 0px 0px 5px">
<div style="font-size:18pt; font-family:verdana; font-weight:bold">
    Database Integration Demo (2)
</div>
<hr style="border:solid 1px #000080" />
<div style="font-size:10pt; font-family:verdana; width:600px">
<%= link_to "Source Code Listing", :controller => "cddemo", :action => "viewsource",
    :ctrl_file => @ctrl_file, :view_file => File.expand_path(__FILE__) %>
<br />
<br />
The example demonstrates creating two charts in the same page using data from a database.
<br />
<br />
<form>
    I want to obtain the revenue data for the year
    <%= select_year(((params["date"] && params["date"]["year"]) || 2001).to_i,
        :start_year => 1992, :end_year => 2001) %>
    <input type="submit" value="OK">
</form>
</div>
<br>
<img src="<%= url_for(:action => 'getchart1') + '?' + @httpParam %>">
<br><br>
<img src="<%= url_for(:action => 'getchart2') + '?' + @httpParam %>">
</body>
</html> |
The main difference between this example and the previous example (Simple Database Chart) is that the database code is moved to the "index" action responsible for the HTML part of the page. After reading the data from the database, the data are serialized into a text string, so they may be passed to the "getchart1" and "getchart2" actions as query parameters.
#
# Query database for the selected year and read results into arrays
#

records = Revenue.find(:all, :conditions => ["Year(TimeStamp) = ?", selectedYear],
    :order => "TimeStamp")

software = []
hardware = []
services = []
records.each do |r|
    software.push(r.Software)
    hardware.push(r.Hardware)
    services.push(r.Services)
end

# Encode data into a query string to be passed to the chart creation methods
@httpParam = sprintf("year=%s&software=%s&hardware=%s&services=%s", selectedYear,
    software.join(","), hardware.join(","), services.join(","))
The "getchart1" and "getchart2" actions are referenced in two <IMG> tags in the view "index.rhtml".
<img src="<%= url_for(:action => 'getchart1') + '?' + @httpParam %>">
<br><br>
<img src="<%= url_for(:action => 'getchart2') + '?' + @httpParam %>">
The "getchart1" and "getchart2" action contain the actual code for creating the two charts. They retrieve the data from the HTTP query parameters and deserialized them back into arrays. Then they use the arrays to draw the charts as usual.