require("chartdirector")
class DepthareaController < ApplicationController
def index()
@title = "Depth Area Chart"
@ctrl_file = File.expand_path(__FILE__)
@noOfCharts = 1
render :template => "templates/chartview"
end
#
# Render and deliver the chart
#
def getchart()
# The data for the area chart
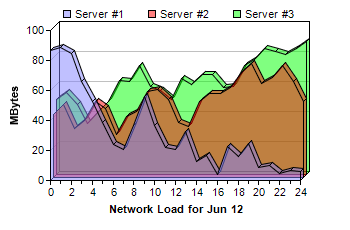
data0 = [42, 49, 33, 38, 51, 46, 29, 41, 44, 57, 59, 52, 37, 34, 51, 56, 56, 60, 70, 76, 63,
67, 75, 64, 51]
data1 = [50, 55, 47, 34, 42, 49, 63, 62, 73, 59, 56, 50, 64, 60, 67, 67, 58, 59, 73, 77, 84,
82, 80, 84, 89]
data2 = [87, 89, 85, 66, 53, 39, 24, 21, 37, 56, 37, 22, 21, 33, 13, 17, 4, 23, 16, 25, 9,
10, 5, 7, 6]
labels = ["0", "1", "2", "3", "4", "5", "6", "7", "8", "9", "10", "11", "12", "13", "14",
"15", "16", "17", "18", "19", "20", "21", "22", "23", "24"]
# Create a XYChart object of size 350 x 230 pixels
c = ChartDirector::XYChart.new(350, 230)
# Set the plotarea at (50, 30) and of size 250 x 150 pixels.
c.setPlotArea(50, 30, 250, 150)
# Add a legend box at (55, 0) (top of the chart) using 8pt Arial Font. Set background and
# border to Transparent.
c.addLegend(55, 0, false, "", 8).setBackground(ChartDirector::Transparent)
# Add a title to the x axis
c.xAxis().setTitle("Network Load for Jun 12")
# Add a title to the y axis
c.yAxis().setTitle("MBytes")
# Set the labels on the x axis.
c.xAxis().setLabels(labels)
# Display 1 out of 2 labels on the x-axis. Show minor ticks for remaining labels.
c.xAxis().setLabelStep(2, 1)
# Add three area layers, each representing one data set. The areas are drawn in
# semi-transparent colors.
c.addAreaLayer(data2, 0x808080ff, "Server #1", 3)
c.addAreaLayer(data0, 0x80ff0000, "Server #2", 3)
c.addAreaLayer(data1, 0x8000ff00, "Server #3", 3)
# Output the chart
send_data(c.makeChart2(ChartDirector::PNG), :type => "image/png", :disposition => "inline")
end
end |