require("chartdirector")
class DepthbarController < ApplicationController
def index()
@title = "Depth Bar Chart"
@ctrl_file = File.expand_path(__FILE__)
@noOfCharts = 1
render :template => "templates/chartview"
end
#
# Render and deliver the chart
#
def getchart()
# The data for the bar chart
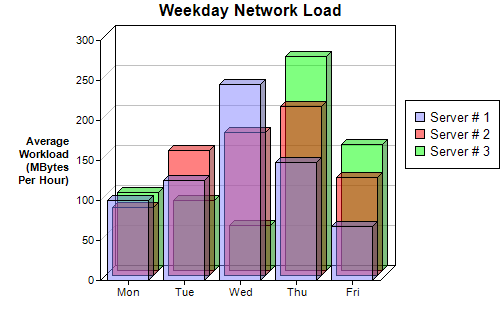
data0 = [100, 125, 245, 147, 67]
data1 = [85, 156, 179, 211, 123]
data2 = [97, 87, 56, 267, 157]
# The labels for the bar chart
labels = ["Mon", "Tue", "Wed", "Thu", "Fri"]
# Create a XYChart object of size 500 x 320 pixels
c = ChartDirector::XYChart.new(500, 320)
# Set the plotarea at (100, 40) and of size 280 x 240 pixels
c.setPlotArea(100, 40, 280, 240)
# Add a legend box at (405, 100)
c.addLegend(405, 100)
# Add a title to the chart
c.addTitle("Weekday Network Load")
# Add a title to the y axis. Draw the title upright (font angle = 0)
c.yAxis().setTitle("Average\nWorkload\n(MBytes\nPer Hour)").setFontAngle(0)
# Set the labels on the x axis
c.xAxis().setLabels(labels)
# Add three bar layers, each representing one data set. The bars are drawn in
# semi-transparent colors.
c.addBarLayer(data0, 0x808080ff, "Server # 1", 5)
c.addBarLayer(data1, 0x80ff0000, "Server # 2", 5)
c.addBarLayer(data2, 0x8000ff00, "Server # 3", 5)
# Output the chart
send_data(c.makeChart2(ChartDirector::PNG), :type => "image/png", :disposition => "inline")
end
end |