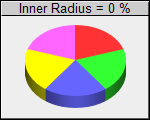
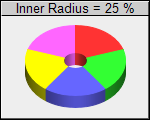
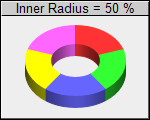
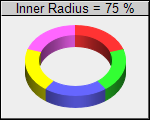
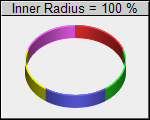
This example demonstrates the effects of different donut widths.
Donut widths are configured by using different inner and outer radii when calling PieChart.setDonutSize.
ChartDirector 6.0 (Ruby Edition)
Donut Width
Source Code Listing
require("chartdirector")

class DonutwidthController < ApplicationController

    def index()
        @title = "Donut Width"
        @ctrl_file = File.expand_path(__FILE__)
        @noOfCharts = 5
        render :template => "templates/chartview"
    end

    #
    # Render and deliver the chart
    #
    def getchart()
        # This script can draw different charts depending on the chartIndex
        chartIndex = (params["img"]).to_i

        # Determine the donut inner radius (as percentage of outer radius) based on input parameter
        donutRadius = chartIndex * 25

        # The data for the pie chart
        data = [10, 10, 10, 10, 10]

        # The labels for the pie chart
        labels = ["Marble", "Wood", "Granite", "Plastic", "Metal"]

        # Create a PieChart object of size 150 x 120 pixels, with a grey (EEEEEE) background, black
        # border and 1 pixel 3D border effect
        c = ChartDirector::PieChart.new(150, 120, 0xeeeeee, 0x000000, 1)

        # Set donut center at (75, 65) and the outer radius to 50 pixels. Inner radius is computed
        # according donutWidth
        c.setDonutSize(75, 60, 50, (50 * donutRadius / 100).to_i)

        # Add a title to show the donut width
        c.addTitle(sprintf("Inner Radius = %s %%", donutRadius), "arial.ttf", 10).setBackground(
            0xcccccc, 0)

        # Draw the pie in 3D
        c.set3D(12)

        # Set the pie data and the pie labels
        c.setData(data, labels)

        # Disable the sector labels by setting the color to Transparent
        c.setLabelStyle("", 8, ChartDirector::Transparent)

        # Output the chart
        send_data(c.makeChart2(ChartDirector::PNG), :type => "image/png", :disposition => "inline")

    end

end |
<html>
<body style="margin:5px 0px 0px 5px">

<!-- Title -->
<div style="font-size:18pt; font-family:verdana; font-weight:bold">
    <%= @title %>
</div>
<hr style="border:solid 1px #000080" />

<!-- Source Code Listing Link -->
<div style="font-size:9pt; font-family:verdana; margin-bottom:1.5em">
    <%= link_to "Source Code Listing",
        :controller => "cddemo", :action => "viewsource",
        :ctrl_file => @ctrl_file, :view_file => File.expand_path(__FILE__) %>
</div>

<!-- Create one or more IMG tags to display the demo chart(s) -->
<% 0.upto(@noOfCharts - 1) do |i| %>
    <img src="<%= url_for(:action => "getchart", :img => i) %>">
<% end %>

</body>
</html> |
#!/usr/bin/env ruby
require("chartdirector")

def createChart(chartIndex)

    # Determine the donut inner radius (as percentage of outer radius) based on input parameter
    donutRadius = chartIndex * 25

    # The data for the pie chart
    data = [10, 10, 10, 10, 10]

    # The labels for the pie chart
    labels = ["Marble", "Wood", "Granite", "Plastic", "Metal"]

    # Create a PieChart object of size 150 x 120 pixels, with a grey (EEEEEE) background, black
    # border and 1 pixel 3D border effect
    c = ChartDirector::PieChart.new(150, 120, 0xeeeeee, 0x000000, 1)

    # Set donut center at (75, 65) and the outer radius to 50 pixels. Inner radius is computed
    # according donutWidth
    c.setDonutSize(75, 60, 50, (50 * donutRadius / 100).to_i)

    # Add a title to show the donut width
    c.addTitle(sprintf("Inner Radius = %s %%", donutRadius), "arial.ttf", 10).setBackground(
        0xcccccc, 0)

    # Draw the pie in 3D
    c.set3D(12)

    # Set the pie data and the pie labels
    c.setData(data, labels)

    # Disable the sector labels by setting the color to Transparent
    c.setLabelStyle("", 8, ChartDirector::Transparent)

    # Output the chart
    c.makeChart("donutwidth%s.png" % chartIndex)
end

createChart(0)
createChart(1)
createChart(2)
createChart(3)
createChart(4) |