require("chartdirector")
class DualhbarController < ApplicationController
def index()
@title = "Dual Horizontal Bar Charts"
@ctrl_file = File.expand_path(__FILE__)
@noOfCharts = 1
render :template => "templates/chartview"
end
#
# Render and deliver the chart
#
def getchart()
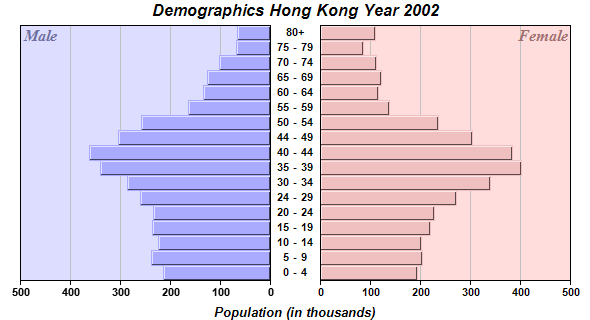
# The age groups
labels = ["0 - 4", "5 - 9", "10 - 14", "15 - 19", "20 - 24", "24 - 29", "30 - 34",
"35 - 39", "40 - 44", "44 - 49", "50 - 54", "55 - 59", "60 - 64", "65 - 69", "70 - 74",
"75 - 79", "80+"]
# The male population (in thousands)
male = [215, 238, 225, 236, 235, 260, 286, 340, 363, 305, 259, 164, 135, 127, 102, 68, 66]
# The female population (in thousands)
female = [194, 203, 201, 220, 228, 271, 339, 401, 384, 304, 236, 137, 116, 122, 112, 85, 110
]
#=============================================================
# Draw the right bar chart
#=============================================================
# Create a XYChart object of size 320 x 300 pixels
c = ChartDirector::XYChart.new(320, 300)
# Set the plotarea at (50, 0) and of size 250 x 255 pixels. Use pink (0xffdddd) as the
# background.
c.setPlotArea(50, 0, 250, 255, 0xffdddd)
# Add a custom text label at the top right corner of the right bar chart
c.addText(300, 0, "Female", "timesbi.ttf", 12, 0xa07070).setAlignment(
ChartDirector::TopRight)
# Add the pink (0xf0c0c0) bar chart layer using the female data
femaleLayer = c.addBarLayer(female, 0xf0c0c0)
# Swap the axis so that the bars are drawn horizontally
c.swapXY(true)
# Set the bar to touch each others
femaleLayer.setBarGap(ChartDirector::TouchBar)
# Set the border style of the bars to 1 pixel 3D border
femaleLayer.setBorderColor(-1, 1)
# Add a Transparent line layer to the chart using the male data. As it is Transparent, only
# the female bar chart can be seen. We need to put both male and female data in both left
# and right charts, because we want auto-scaling to produce the same scale for both chart.
c.addLineLayer(male, ChartDirector::Transparent)
# Set the y axis label font to Arial Bold
c.yAxis().setLabelStyle("arialbd.ttf")
# Set the labels between the two bar charts, which can be considered as the x-axis labels
# for the right chart
tb = c.xAxis().setLabels(labels)
# Use a fix width of 50 for the labels (height = automatic) with center alignment
tb.setSize(50, 0)
tb.setAlignment(ChartDirector::Center)
# Set the label font to Arial Bold
tb.setFontStyle("arialbd.ttf")
# Disable ticks on the x-axis by setting the tick length to 0
c.xAxis().setTickLength(0)
#=============================================================
# Draw the left bar chart
#=============================================================
# Create a XYChart object of size 280 x 300 pixels with a transparent background.
c2 = ChartDirector::XYChart.new(280, 300, ChartDirector::Transparent)
# Set the plotarea at (20, 0) and of size 250 x 255 pixels. Use pale blue (0xddddff) as the
# background.
c2.setPlotArea(20, 0, 250, 255, 0xddddff)
# Add a custom text label at the top left corner of the left bar chart
c2.addText(20, 0, "Male", "timesbi.ttf", 12, 0x7070a0)
# Add the pale blue (0xaaaaff) bar chart layer using the male data
maleLayer = c2.addBarLayer(male, 0xaaaaff)
# Swap the axis so that the bars are drawn horizontally
c2.swapXY(true)
# Reverse the direction of the y-axis so it runs from right to left
c2.yAxis().setReverse()
# Set the bar to touch each others
maleLayer.setBarGap(ChartDirector::TouchBar)
# Set the border style of the bars to 1 pixel 3D border
maleLayer.setBorderColor(-1, 1)
# Add a Transparent line layer to the chart using the female data. As it is Transparent,
# only the male bar chart can be seen. We need to put both male and female data in both left
# and right charts, because we want auto-scaling to produce the same scale for both chart.
c2.addLineLayer(female, ChartDirector::Transparent)
# Set the y axis label font to Arial Bold
c2.yAxis().setLabelStyle("arialbd.ttf")
#=============================================================
# Use a MultiChart to contain both bar charts
#=============================================================
# Create a MultiChart object of size 590 x 320 pixels.
m = ChartDirector::MultiChart.new(590, 320)
# Add a title to the chart using Arial Bold Italic font
m.addTitle("Demographics Hong Kong Year 2002", "arialbi.ttf")
# Add another title at the bottom using Arial Bold Italic font
m.addTitle2(ChartDirector::Bottom, "Population (in thousands)", "arialbi.ttf", 10)
# Put the right chart at (270, 25)
m.addChart(270, 25, c)
# Put the left chart at (0, 25)
m.addChart(0, 25, c2)
# Output the chart
send_data(m.makeChart2(ChartDirector::PNG), :type => "image/png", :disposition => "inline")
end
end |