To get a feeling of using ChartDirector, and to verify the ChartDirector development environment is set up properly, we will begin by building a very simple bar chart.
The following sample code comes from the Ruby On Rails sample programs included in the ChartDirector distribution. If you have not yet tried the sample programs, it is highly recommended you try them now. Please refer to the Installation section for details. They are very useful for exploring and testing the features of ChartDirector.
[Ruby On Rails Version - Controller] app/controllers/simplebar_controller.rb
require("chartdirector")
class SimplebarController < ApplicationController
def index()
@title = "Simple Bar Chart (1)"
@ctrl_file = File.expand_path(__FILE__)
@noOfCharts = 1
render :template => "templates/chartview"
end
#
# Render and deliver the chart
#
def getchart()
# The data for the bar chart
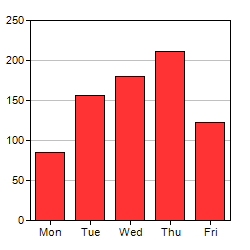
data = [85, 156, 179.5, 211, 123]
# The labels for the bar chart
labels = ["Mon", "Tue", "Wed", "Thu", "Fri"]
# Create a XYChart object of size 250 x 250 pixels
c = ChartDirector::XYChart.new(250, 250)
# Set the plotarea at (30, 20) and of size 200 x 200 pixels
c.setPlotArea(30, 20, 200, 200)
# Add a bar chart layer using the given data
c.addBarLayer(data)
# Set the labels on the x axis.
c.xAxis().setLabels(labels)
# Output the chart
send_data(c.makeChart2(ChartDirector::PNG), :type => "image/png", :disposition => "inline")
end
end |
[Ruby On Rails Version - View] app/views/templates/chartview.html.erb
<html>
<body style="margin:5px 0px 0px 5px">

<!-- Title -->
<div style="font-size:18pt; font-family:verdana; font-weight:bold">
    <%= @title %>
</div>
<hr style="border:solid 1px #000080" />

<!-- Source Code Listing Link -->
<div style="font-size:9pt; font-family:verdana; margin-bottom:1.5em">
    <%= link_to "Source Code Listing",
        :controller => "cddemo", :action => "viewsource",
        :ctrl_file => @ctrl_file, :view_file => File.expand_path(__FILE__) %>
</div>

<!-- Create one or more IMG tags to display the demo chart(s) -->
<% 0.upto(@noOfCharts - 1) do |i| %>
    <img src="<%= url_for(:action => "getchart", :img => i) %>">
<% end %>

</body>
</html> |
The controller part of the code has two actions - "index" and "getchart". The default action "index" and the associate view "chartview.rhtml" are standard code used in almost all ChartDirector examples. They simply create a web page to contain one of more charts. The key line of code is:
<img src="<%= url_for(:action => "getchart", :img => i) %>">
The above code includes the chart in the web page. The chart is generated using the action "getchart", which contains the actual charting code. The key parts of the charting code are explained below:
require("chartdirector.rb")
This line loads the ChartDirector for Ruby module so that you can use it.
c = ChartDirector::XYChart.new(250, 250)
The first step in creating any chart in ChartDirector is to create the appropriate chart object. In this example, an XYChart object of size 250 x 250 pixels is created. In ChartDirector, XYChart represents any chart that has x-axis and y-axis, such as the bar chart we are drawing.
c.setPlotArea(30, 30, 200, 200)
The second step in creating a bar chart is to specify where should we draw the bar chart. This is by specifying the rectangle that contains the bar chart. The rectangle is specified by using the (x, y) coordinates of its top-left corner, together with its width and height.
For this simple bar chart, we will use the majority of the chart area to draw the bar chart. We will leave some margin to allow for the text labels on the axis. In the above code, the top-left corner is set to (30, 30), and both the width and height is set to 200 pixels. Since the entire chart is 250 x 250 in size, there will be 20 to 30 pixels margin for the text labels.
Note that ChartDirector uses a pixel coordinate system that is customary for computer screen. The x pixel coordinate is increasing from left to right. The y pixel coordinate is increasing from top to bottom. The origin (0, 0) is at the top-left corner.
For more complex charts which may contain titles, legend box and other things, we can use this method (and other methods) to design the exact layout of the entire chart.
c.addBarLayer(data)
The above code adds a bar layer to the XYChart. In ChartDirector, any chart type that has x-axis and y-axis is represented as a layer in the XYChart. An XYChart can contain multiple layers. This allows "combination charts" to be created easily by combining different layers on the same chart (eg., a chart containing a line layer on top of a bar layer) .
In the above line of code, the argument is an array of numbers representing the values of the data points.
c.xAxis().setLabels(labels)
The above code sets the labels on the x-axis. The first method XYChart.xAxis retrieves the Axis object that represents the x-axis. The second method Axis.setLabels binds the text labels to the x-axis. The argument to the setLabels method is an array of text strings.
send_data(c.makeChart2(ChartDirector::PNG), :type => "image/png",
    :disposition => "inline")
The above code outputs the chart directly to the browser as a PNG image stream. No intermediate file is needed.
For the image format, in addition to PNG, ChartDirector supports JPG, GIF, BMP and WBMP.
Note: If you are running ChartDirector on Linux/FreeBSD/Solaris, the charts produced may be slightly different from the chart samples in this documentation, which are produced under Windows. This is because of the different fonts available on Windows and Linux/FreeBSD/Solaris. Please refer to Font Specification on why you may want to download Windows fonts to be used on Linux/FreeBSD/Solaris.
Note: The trial version of ChartDirector will include small yellow banners at the bottom of the charts it produces. These banners will disappear in the licensed version of ChartDirector.