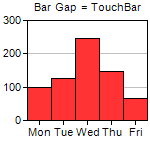
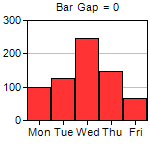
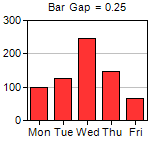

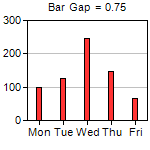
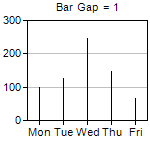
This example demonstrates the effects of different bar gaps configured using BarLayer.setBarGap.
ChartDirector 6.0 (Ruby Edition)
Bar Gap
Source Code Listing
require("chartdirector")

class GapbarController < ApplicationController

    def index()
        @title = "Bar Gap"
        @ctrl_file = File.expand_path(__FILE__)
        @noOfCharts = 6
        render :template => "templates/chartview"
    end

    #
    # Render and deliver the chart
    #
    def getchart()
        # This script can draw different charts depending on the chartIndex
        chartIndex = (params["img"]).to_i

        bargap = chartIndex * 0.25 - 0.25

        # The data for the bar chart
        data = [100, 125, 245, 147, 67]

        # The labels for the bar chart
        labels = ["Mon", "Tue", "Wed", "Thu", "Fri"]

        # Create a XYChart object of size 150 x 150 pixels
        c = ChartDirector::XYChart.new(150, 150)

        # Set the plotarea at (27, 20) and of size 120 x 100 pixels
        c.setPlotArea(27, 20, 120, 100)

        # Set the labels on the x axis
        c.xAxis().setLabels(labels)

        if bargap >= 0
            # Add a title to display to bar gap using 8pt Arial font
            c.addTitle(sprintf("      Bar Gap = %s", bargap), "arial.ttf", 8)
        else
            # Use negative value to mean TouchBar
            c.addTitle("      Bar Gap = TouchBar", "arial.ttf", 8)
            bargap = ChartDirector::TouchBar
        end

        # Add a bar chart layer using the given data and set the bar gap
        c.addBarLayer(data).setBarGap(bargap)

        # Output the chart
        send_data(c.makeChart2(ChartDirector::PNG), :type => "image/png", :disposition => "inline")

    end

end |
<html>
<body style="margin:5px 0px 0px 5px">

<!-- Title -->
<div style="font-size:18pt; font-family:verdana; font-weight:bold">
    <%= @title %>
</div>
<hr style="border:solid 1px #000080" />

<!-- Source Code Listing Link -->
<div style="font-size:9pt; font-family:verdana; margin-bottom:1.5em">
    <%= link_to "Source Code Listing",
        :controller => "cddemo", :action => "viewsource",
        :ctrl_file => @ctrl_file, :view_file => File.expand_path(__FILE__) %>
</div>

<!-- Create one or more IMG tags to display the demo chart(s) -->
<% 0.upto(@noOfCharts - 1) do |i| %>
    <img src="<%= url_for(:action => "getchart", :img => i) %>">
<% end %>

</body>
</html> |
#!/usr/bin/env ruby
require("chartdirector")

def createChart(chartIndex)

    bargap = chartIndex * 0.25 - 0.25

    # The data for the bar chart
    data = [100, 125, 245, 147, 67]

    # The labels for the bar chart
    labels = ["Mon", "Tue", "Wed", "Thu", "Fri"]

    # Create a XYChart object of size 150 x 150 pixels
    c = ChartDirector::XYChart.new(150, 150)

    # Set the plotarea at (27, 20) and of size 120 x 100 pixels
    c.setPlotArea(27, 20, 120, 100)

    # Set the labels on the x axis
    c.xAxis().setLabels(labels)

    if bargap >= 0
        # Add a title to display to bar gap using 8pt Arial font
        c.addTitle(sprintf("      Bar Gap = %s", bargap), "arial.ttf", 8)
    else
        # Use negative value to mean TouchBar
        c.addTitle("      Bar Gap = TouchBar", "arial.ttf", 8)
        bargap = ChartDirector::TouchBar
    end

    # Add a bar chart layer using the given data and set the bar gap
    c.addBarLayer(data).setBarGap(bargap)

    # Output the chart
    c.makeChart("gapbar%s.png" % chartIndex)
end

createChart(0)
createChart(1)
createChart(2)
createChart(3)
createChart(4)
createChart(5) |