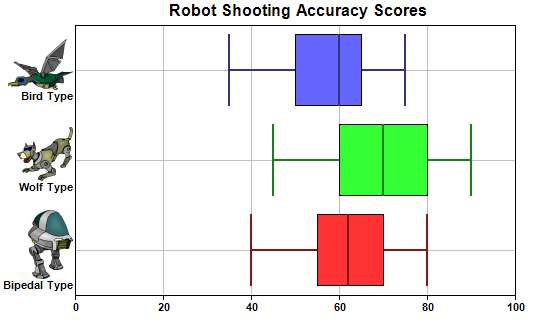
This example demonstrates creating a multi-color horizontal box-whisker chart.
XYChart.addBoxWhiskerLayer2 is used to create the multi-color box-whisker layer. The chart is set to horizontal orientation using XYChart.swapXY.
ChartDirector 6.0 (Ruby Edition)
Horizontal Box-Whisker Chart
Source Code Listing
require("chartdirector")

class HboxwhiskerController < ApplicationController

    def index()
        @title = "Horizontal Box-Whisker Chart"
        @ctrl_file = File.expand_path(__FILE__)
        @noOfCharts = 1
        render :template => "templates/chartview"
    end

    #
    # Render and deliver the chart
    #
    def getchart()
        # Sample data for the Box-Whisker chart. Represents the minimum, 1st quartile, medium, 3rd
        # quartile and maximum values of some quantities
        q0Data = [40, 45, 35]
        q1Data = [55, 60, 50]
        q2Data = [62, 70, 60]
        q3Data = [70, 80, 65]
        q4Data = [80, 90, 75]

        # The labels for the chart
        labels = ["<*img=robot1.png*><*br*>Bipedal Type", "<*img=robot2.png*><*br*>Wolf Type",
            "<*img=robot5.png*><*br*>Bird Type"]

        # Create a XYChart object of size 540 x 320 pixels
        c = ChartDirector::XYChart.new(540, 320)

        # swap the x and y axes to create a horizontal box-whisker chart
        c.swapXY()

        # Set directory for loading images to current script directory
        c.setSearchPath(File.dirname(__FILE__))

        # Set the plotarea at (75, 25) and of size 440 x 270 pixels. Enable both horizontal and
        # vertical grids by setting their colors to grey (0xc0c0c0)
        c.setPlotArea(75, 25, 440, 270).setGridColor(0xc0c0c0, 0xc0c0c0)

        # Add a title to the chart
        c.addTitle("           Robot Shooting Accuracy Scores")

        # Set the labels on the x axis and the font to Arial Bold
        c.xAxis().setLabels(labels).setFontStyle("arialbd.ttf")

        # Disable x axis ticks by setting the length to 0
        c.xAxis().setTickLength(0)

        # Set the font for the y axis labels to Arial Bold
        c.yAxis().setLabelStyle("arialbd.ttf")

        # Add a Box Whisker layer using light blue 0x9999ff as the fill color and blue (0xcc) as the
        # line color. Set the line width to 2 pixels
        c.addBoxWhiskerLayer2(q3Data, q1Data, q4Data, q0Data, q2Data).setLineWidth(2)

        # Output the chart
        send_data(c.makeChart2(ChartDirector::PNG), :type => "image/png", :disposition => "inline")

    end

end |
<html>
<body style="margin:5px 0px 0px 5px">

<!-- Title -->
<div style="font-size:18pt; font-family:verdana; font-weight:bold">
    <%= @title %>
</div>
<hr style="border:solid 1px #000080" />

<!-- Source Code Listing Link -->
<div style="font-size:9pt; font-family:verdana; margin-bottom:1.5em">
    <%= link_to "Source Code Listing",
        :controller => "cddemo", :action => "viewsource",
        :ctrl_file => @ctrl_file, :view_file => File.expand_path(__FILE__) %>
</div>

<!-- Create one or more IMG tags to display the demo chart(s) -->
<% 0.upto(@noOfCharts - 1) do |i| %>
    <img src="<%= url_for(:action => "getchart", :img => i) %>">
<% end %>

</body>
</html> |
#!/usr/bin/env ruby
require("chartdirector")

# Sample data for the Box-Whisker chart. Represents the minimum, 1st quartile, medium, 3rd quartile
# and maximum values of some quantities
q0Data = [40, 45, 35]
q1Data = [55, 60, 50]
q2Data = [62, 70, 60]
q3Data = [70, 80, 65]
q4Data = [80, 90, 75]

# The labels for the chart
labels = ["<*img=robot1.png*><*br*>Bipedal Type", "<*img=robot2.png*><*br*>Wolf Type",
    "<*img=robot5.png*><*br*>Bird Type"]

# Create a XYChart object of size 540 x 320 pixels
c = ChartDirector::XYChart.new(540, 320)

# swap the x and y axes to create a horizontal box-whisker chart
c.swapXY()

# Set the plotarea at (75, 25) and of size 440 x 270 pixels. Enable both horizontal and vertical
# grids by setting their colors to grey (0xc0c0c0)
c.setPlotArea(75, 25, 440, 270).setGridColor(0xc0c0c0, 0xc0c0c0)

# Add a title to the chart
c.addTitle("           Robot Shooting Accuracy Scores")

# Set the labels on the x axis and the font to Arial Bold
c.xAxis().setLabels(labels).setFontStyle("arialbd.ttf")

# Disable x axis ticks by setting the length to 0
c.xAxis().setTickLength(0)

# Set the font for the y axis labels to Arial Bold
c.yAxis().setLabelStyle("arialbd.ttf")

# Add a Box Whisker layer using light blue 0x9999ff as the fill color and blue (0xcc) as the line
# color. Set the line width to 2 pixels
c.addBoxWhiskerLayer2(q3Data, q1Data, q4Data, q0Data, q2Data).setLineWidth(2)

# Output the chart
c.makeChart("hboxwhisker.png") |