require("chartdirector")
class HlinearmeterorientationController < ApplicationController
def index()
@title = "H-Linear Meter Orientation"
@ctrl_file = File.expand_path(__FILE__)
@noOfCharts = 4
render :template => "templates/chartview"
end
#
# Render and deliver the chart
#
def getchart()
# This script can draw different charts depending on the chartIndex
chartIndex = (params["img"]).to_i
# The value to display on the meter
value = 74.25
# Create a LinearMeter object of size 250 x 75 pixels with very light grey (0xeeeeee)
# backgruond and a light grey (0xccccccc) 3-pixel thick rounded frame
m = ChartDirector::LinearMeter.new(250, 75, 0xeeeeee, 0xcccccc)
m.setRoundedFrame(ChartDirector::Transparent)
m.setThickFrame(3)
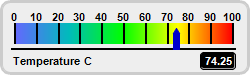
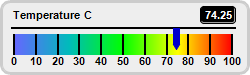
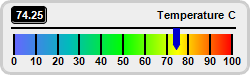
# This example demonstrates putting the text labels at the top or bottom. This is by setting
# the label alignment, scale position and label position.
alignment = [ChartDirector::Top, ChartDirector::Top, ChartDirector::Bottom,
ChartDirector::Bottom]
meterYPos = [23, 23, 34, 34]
labelYPos = [61, 61, 15, 15]
# Set the scale region
m.setMeter(14, meterYPos[chartIndex], 218, 20, alignment[chartIndex])
# Set meter scale from 0 - 100, with a tick every 10 units
m.setScale(0, 100, 10)
# Add a smooth color scale at the default position
smoothColorScale = [0, 0x6666ff, 25, 0x00bbbb, 50, 0x00ff00, 75, 0xffff00, 100, 0xff0000]
m.addColorScale(smoothColorScale)
# Add a blue (0x0000cc) pointer at the specified value
m.addPointer(value, 0x0000cc)
#
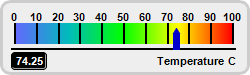
# In this example, some charts have the "Temperauture" label on the left side and the value
# readout on the right side, and some charts have the reverse
#
if chartIndex % 2 == 0
# Add a label on the left side using 8pt Arial Bold font
m.addText(10, labelYPos[chartIndex], "Temperature C", "arialbd.ttf", 8,
ChartDirector::TextColor, ChartDirector::Left)
# Add a text box on the right side. Display the value using white (0xffffff) 8pt Arial
# Bold font on a black (0x000000) background with depressed rounded border.
t = m.addText(235, labelYPos[chartIndex], m.formatValue(value, "2"), "arialbd.ttf", 8,
0xffffff, ChartDirector::Right)
t.setBackground(0x000000, 0x000000, -1)
t.setRoundedCorners(3)
else
# Add a label on the right side using 8pt Arial Bold font
m.addText(237, labelYPos[chartIndex], "Temperature C", "arialbd.ttf", 8,
ChartDirector::TextColor, ChartDirector::Right)
# Add a text box on the left side. Display the value using white (0xffffff) 8pt Arial
# Bold font on a black (0x000000) background with depressed rounded border.
t = m.addText(11, labelYPos[chartIndex], m.formatValue(value, "2"), "arialbd.ttf", 8,
0xffffff, ChartDirector::Left)
t.setBackground(0x000000, 0x000000, -1)
t.setRoundedCorners(3)
end
# Output the chart
send_data(m.makeChart2(ChartDirector::PNG), :type => "image/png", :disposition => "inline")
end
end |