ChartDirector 6.0 (Ruby Edition)

Icon Pie Chart (1)


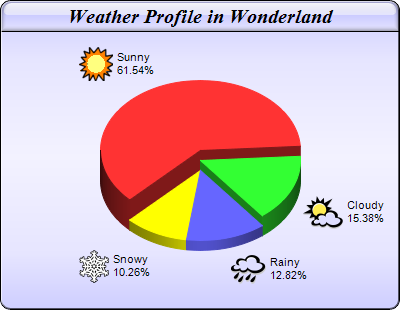
This example demonstrates using CDML and Parameter Substitution and Formatting to include icons in sector labels. It also demonstrates gradient background color, glass shading effect for the title and rounded corners for the chart frame.

Source Code Listing

[Ruby On Rails Version - Controller] app/controllers/iconpie_controller.rb
require("chartdirector")

class IconpieController < ApplicationController

    def index()
        @title = "Icon Pie Chart (1)"
        @ctrl_file = File.expand_path(__FILE__)
        @noOfCharts = 1
        render :template => "templates/chartview"
    end

    #
    # Render and deliver the chart
    #
    def getchart()
        # The data for the pie chart
        data = [72, 18, 15, 12]

        # The depths for the sectors
        depths = [30, 20, 10, 10]

        # The labels for the pie chart
        labels = ["Sunny", "Cloudy", "Rainy", "Snowy"]

        # The icons for the sectors
        icons = ["sun.png", "cloud.png", "rain.png", "snowy.png"]

        # Create a PieChart object of size 400 x 310 pixels, with a blue (CCCCFF) vertical metal
        # gradient background, black border, 1 pixel 3D border effect and rounded corners
        c = ChartDirector::PieChart.new(400, 310, ChartDirector::metalColor(0xccccff, 0), 0x000000,
            1)
        c.setRoundedFrame()

        # Set directory for loading images to current script directory
        c.setSearchPath(File.dirname(__FILE__))

        # Set the center of the pie at (200, 180) and the radius to 100 pixels
        c.setPieSize(200, 180, 100)

        # Add a title box using 15pt Times Bold Italic font, on a blue (CCCCFF) background with
        # glass effect
        c.addTitle("Weather Profile in Wonderland", "timesbi.ttf", 15).setBackground(0xccccff,
            0x000000, ChartDirector::glassEffect())

        # Set the pie data and the pie labels
        c.setData(data, labels)

        # Add icons to the chart as a custom field
        c.addExtraField(icons)

        # Configure the sector labels using CDML to include the icon images
        c.setLabelFormat(
            "<*block,valign=absmiddle*><*img={field0}*> <*block*>{label}\n{percent}%<*/*><*/*>")

        # Draw the pie in 3D with variable 3D depths
        c.set3D2(depths)

        # Set the start angle to 225 degrees may improve layout when the depths of the sector are
        # sorted in descending order, because it ensures the tallest sector is at the back.
        c.setStartAngle(225)

        # Output the chart
        send_data(c.makeChart2(ChartDirector::PNG), :type => "image/png", :disposition => "inline")

    end

end

[Ruby On Rails Version - View] app/views/templates/chartview.html.erb
<html>
<body style="margin:5px 0px 0px 5px">

<!-- Title -->
<div style="font-size:18pt; font-family:verdana; font-weight:bold">
    <%= @title %>
</div>
<hr style="border:solid 1px #000080" />

<!-- Source Code Listing Link -->
<div style="font-size:9pt; font-family:verdana; margin-bottom:1.5em">
    <%= link_to "Source Code Listing", 
        :controller => "cddemo", :action => "viewsource",
        :ctrl_file => @ctrl_file, :view_file => File.expand_path(__FILE__) %>
</div>

<!-- Create one or more IMG tags to display the demo chart(s) -->
<% 0.upto(@noOfCharts - 1) do |i| %>
    <img src="<%= url_for(:action => "getchart", :img => i) %>">
<% end %>

</body>
</html>

[Command Line Version] rubydemo/iconpie.rb
#!/usr/bin/env ruby
require("chartdirector")

# The data for the pie chart
data = [72, 18, 15, 12]

# The depths for the sectors
depths = [30, 20, 10, 10]

# The labels for the pie chart
labels = ["Sunny", "Cloudy", "Rainy", "Snowy"]

# The icons for the sectors
icons = ["sun.png", "cloud.png", "rain.png", "snowy.png"]

# Create a PieChart object of size 400 x 310 pixels, with a blue (CCCCFF) vertical metal gradient
# background, black border, 1 pixel 3D border effect and rounded corners
c = ChartDirector::PieChart.new(400, 310, ChartDirector::metalColor(0xccccff, 0), 0x000000, 1)
c.setRoundedFrame()

# Set the center of the pie at (200, 180) and the radius to 100 pixels
c.setPieSize(200, 180, 100)

# Add a title box using 15pt Times Bold Italic font, on a blue (CCCCFF) background with glass effect
c.addTitle("Weather Profile in Wonderland", "timesbi.ttf", 15).setBackground(0xccccff, 0x000000,
    ChartDirector::glassEffect())

# Set the pie data and the pie labels
c.setData(data, labels)

# Add icons to the chart as a custom field
c.addExtraField(icons)

# Configure the sector labels using CDML to include the icon images
c.setLabelFormat("<*block,valign=absmiddle*><*img={field0}*> <*block*>{label}\n{percent}%<*/*><*/*>"
    )

# Draw the pie in 3D with variable 3D depths
c.set3D2(depths)

# Set the start angle to 225 degrees may improve layout when the depths of the sector are sorted in
# descending order, because it ensures the tallest sector is at the back.
c.setStartAngle(225)

# Output the chart
c.makeChart("iconpie.png")